Wells Fargo 2008 Annual Report Download - page 167
Download and view the complete annual report
Please find page 167 of the 2008 Wells Fargo annual report below. You can navigate through the pages in the report by either clicking on the pages listed below, or by using the keyword search tool below to find specific information within the annual report.-
 1
1 -
2
-
3
-
4
-
5
-
6
-
7
-
8
-
9
-
10
-
11
-
12
-
13
-
14
-
15
-
16
-
17
-
18
-
19
-
20
-
21
-
22
-
23
-
24
-
25
-
26
-
27
-
28
-
29
-
30
-
31
-
32
-
33
-
34
-
35
-
36
-
37
-
38
-
39
-
40
-
41
-
42
-
43
-
44
-
45
-
46
-
47
-
48
-
49
-
50
-
51
-
52
-
53
-
54
-
55
-
56
-
57
-
58
-
59
-
60
-
61
-
62
-
63
-
64
-
65
-
66
-
67
-
68
-
69
-
70
-
71
-
72
-
73
-
74
-
75
-
76
-
77
-
78
-
79
-
80
-
81
-
82
-
83
-
84
-
85
-
86
-
87
-
88
-
89
-
90
-
91
-
92
-
93
-
94
-
95
-
96
-
97
-
98
-
99
-
100
-
101
-
102
-
103
-
104
-
105
-
106
-
107
-
108
-
109
-
110
-
111
-
112
-
113
-
114
-
115
-
116
-
117
-
118
-
119
-
120
-
121
-
122
-
123
-
124
-
125
-
126
-
127
-
128
-
129
-
130
-
131
-
132
-
133
-
134
-
135
-
136
-
137
-
138
-
139
-
140
-
141
-
142
-
143
-
144
-
145
-
146
-
147
-
148
-
149
-
150
-
151
-
152
-
153
-
154
-
155
-
156
-
 157
157 -
 158
158 -
 159
159 -
 160
160 -
 161
161 -
 162
162 -
 163
163 -
 164
164 -
 165
165 -
 166
166 -
 167
167 -
 168
168 -
 169
169 -
 170
170 -
 171
171 -
 172
172
 |
 |

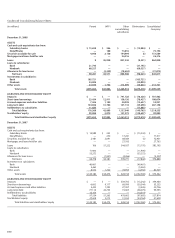
Quarterly Financial Data
Condensed Consolidated Statement of Income — Quarterly (Unaudited)
(in millions, except per share amounts) 2008 2007
Quarter ended Quarter ended
Dec. 31 Sept. 30 June 30 Mar. 31 Dec. 31 Sept. 30 June 30 Mar. 31
INTEREST INCOME $ 8,728 $ 8,774 $ 8,547 $ 8,849 $ 9,242 $ 9,223 $ 8,573 $ 8,139
INTEREST EXPENSE 2,004 2,393 2,269 3,089 3,754 3,943 3,377 3,129
NET INTEREST INCOME 6,724 6,381 6,278 5,760 5,488 5,280 5,196 5,010
Provision for credit losses 8,444 2,495 3,012 2,028 2,612 892 720 715
Net interest income after
provision for credit losses (1,720) 3,886 3,266 3,732 2,876 4,388 4,476 4,295
NONINTEREST INCOME
Service charges on deposit accounts 803 839 800 748 788 837 740 685
Trust and investment fees 661 738 762 763 802 777 839 731
Card fees 589 601 588 558 588 561 517 470
Other fees 535 552 511 499 577 566 638 511
Mortgage banking (195) 892 1,197 631 831 823 689 790
Operating leases 62 102 120 143 153 171 187 192
Insurance 337 439 550 504 370 329 432 399
Net gains (losses) on debt securities
available for sale 721 84 (91) 323 60 160 (42) 31
Net gains (losses) from equity investments (589) (507) 46 313 222 173 242 97
Other (152) 258 698 321 326 176 453 525
Total noninterest income 2,772 3,998 5,181 4,803 4,717 4,573 4,695 4,431
NONINTEREST EXPENSE
Salaries 2,168 2,078 2,030 1,984 2,055 1,933 1,907 1,867
Commission and incentive compensation 671 555 806 644 840 802 900 742
Employee benefits 338 486 593 587 558 518 581 665
Equipment 402 302 305 348 370 295 292 337
Net occupancy 418 402 400 399 413 398 369 365
Operating leases 81 90 102 116 124 136 148 153
Other 1,744 1,604 1,624 1,384 1,540 1,589 1,530 1,397
Total noninterest expense 5,822 5,517 5,860 5,462 5,900 5,671 5,727 5,526
INCOME (LOSS) BEFORE INCOME TAX
EXPENSE (BENEFIT) (4,770) 2,367 2,587 3,073 1,693 3,290 3,444 3,200
Income tax expense (benefit) (2,036) 730 834 1,074 332 1,117 1,165 956
NET INCOME (LOSS) $ (2,734) $ 1,637 $ 1,753 $ 1,999 $ 1,361 $ 2,173 $ 2,279 $ 2,244
NET INCOME (LOSS) APPLICABLE
TO COMMON STOCK $ (3,020) $ 1,637 $ 1,753 $ 1,999 $ 1,361 $ 2,173 $ 2,279 $ 2,244
EARNINGS (LOSS) PER COMMON SHARE $ (0.84) $ 0.49 $ 0.53 $ 0.61 $ 0.41 $ 0.65 $ 0.68 $ 0.66
DILUTED EARNINGS (LOSS) PER
COMMON SHARE $ (0.84) $ 0.49 $ 0.53 $ 0.60 $ 0.41 $ 0.64 $ 0.67 $ 0.66
DIVIDENDS DECLARED PER COMMON SHARE $ 0.34 $ 0.34 $ 0.31 $ 0.31 $ 0.31 $ 0.31 $ 0.28 $ 0.28
Average common shares outstanding 3,582.4 3,316.4 3,309.8 3,302.4 3,327.6 3,339.6 3,351.2 3,376.0
Diluted average common shares outstanding 3,593.6 3,331.0 3,321.4 3,317.9 3,352.2 3,374.0 3,389.3 3,416.1
Market price per common share (1)
High $ 38.95 $ 44.68 $ 32.40 $ 34.56 $ 37.78 $ 37.99 $ 36.49 $ 36.64
Low 19.89 20.46 23.46 24.38 29.29 32.66 33.93 33.01
Quarter end 29.48 37.53 23.75 29.10 30.19 35.62 35.17 34.43
(1) Based on daily prices reported on the New York Stock Exchange Composite Transaction Reporting System.