Wells Fargo 2008 Annual Report Download - page 111
Download and view the complete annual report
Please find page 111 of the 2008 Wells Fargo annual report below. You can navigate through the pages in the report by either clicking on the pages listed below, or by using the keyword search tool below to find specific information within the annual report.-
 1
1 -
2
-
3
-
4
-
5
-
6
-
7
-
8
-
9
-
10
-
11
-
12
-
13
-
14
-
15
-
16
-
17
-
18
-
19
-
20
-
21
-
22
-
23
-
24
-
25
-
26
-
27
-
28
-
29
-
30
-
31
-
32
-
33
-
34
-
35
-
36
-
37
-
38
-
39
-
40
-
41
-
42
-
43
-
44
-
45
-
46
-
47
-
48
-
49
-
50
-
51
-
52
-
53
-
54
-
55
-
56
-
57
-
58
-
59
-
60
-
61
-
62
-
63
-
64
-
65
-
66
-
67
-
68
-
69
-
70
-
71
-
72
-
73
-
74
-
75
-
76
-
77
-
78
-
79
-
80
-
81
-
82
-
83
-
84
-
85
-
86
-
87
-
88
-
89
-
90
-
91
-
92
-
93
-
94
-
95
-
96
-
97
-
98
-
99
-
100
-
 101
101 -
 102
102 -
 103
103 -
 104
104 -
 105
105 -
 106
106 -
 107
107 -
 108
108 -
 109
109 -
 110
110 -
 111
111 -
 112
112 -
 113
113 -
 114
114 -
 115
115 -
 116
116 -
 117
117 -
 118
118 -
 119
119 -
 120
120 -
 121
121 -
122
-
123
-
124
-
125
-
126
-
127
-
128
-
129
-
130
-
131
-
132
-
133
-
134
-
135
-
136
-
137
-
138
-
139
-
140
-
141
-
142
-
143
-
144
-
145
-
146
-
147
-
148
-
149
-
150
-
151
-
152
-
153
-
154
-
155
-
156
-
157
-
158
-
159
-
160
-
161
-
162
-
163
-
164
-
165
-
166
-
167
-
168
-
169
-
170
-
171
-
172
 |
 |

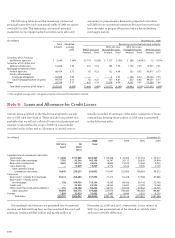
Forecasted losses are compared with actual losses and
this information is used by management in order to develop
an allowance that management believes adequate to cover
losses inherent in the loan portfolio as of the reporting date.
The portion of the allowance for commercial loans,
commercial real estate loans and lease financing was
$4.5 billion at December 31, 2008. We initially estimate this
portion of the allowance by applying historical loss factors
statistically derived from tracking losses associated with
actual portfolio movements over a specified period of time,
for each specific loan grade. Based on this process, we assign
loss factors to each pool of graded loans and a loan equivalent
amount for unfunded loan commitments and letters of credit.
These estimates are then adjusted or supplemented where
necessary from additional analysis of long-term average loss
experience, external loss data or other risks identified from
current conditions and trends in selected portfolios, including
management’s judgment for imprecision and uncertainty.
We also assess and account for certain nonaccrual
commercial and commercial real estate loans that are over
$5 million and certain consumer, commercial and commercial
real estate loans whose terms have been modified in a troubled
debt restructuring as impaired. We include the impairment
on these nonperforming loans in the allowance unless it has
already been recognized as a loss. At December 31, 2008,
we included $816 million in the allowance related to these
impaired loans.
Reflected in the portions of the allowance previously
described is an amount for imprecision or uncertainty that
incorporates the range of probable outcomes inherent in
estimates used for the allowance, which may change from
period to period. This amount is the result of our judgment
of risks inherent in the portfolios, economic uncertainties,
historical loss experience and other subjective factors,
including industry trends, calculated to better reflect our
view of risk in each loan portfolio.
In addition, the allowance for credit losses included a
reserve for unfunded credit commitments of $698 million
at December 31, 2008.
The total allowance reflects management’s estimate
of credit losses inherent in the loan portfolio at the balance
sheet date. We consider the allowance for credit losses
of $21.7 billion adequate to cover credit losses inherent in
the loan portfolio, including unfunded credit commitments,
at December 31, 2008.
Nonaccrual loans were $6,800 million and $2,679 million
at December 31, 2008 and 2007, respectively. There were no
loans accounted for under SOP 03-3 recorded as nonaccrual.
Loans past due 90 days or more as to interest or principal
and still accruing interest were $12,645 million at December 31,
2008, and $6,393 million at December 31, 2007. The 2008 and
2007 balances included $8,185 million and $4,834 million,
respectively, in advances pursuant to our servicing agreements
to the Government National Mortgage Association (GNMA)
mortgage pools and similar loans whose repayments are
insured by the Federal Housing Administration or guaranteed
by the Department of Veterans Affairs.
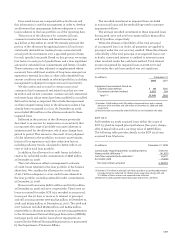
The recorded investment in impaired loans included
in nonaccrual loans and the methodology used to measure
impairment follows.
The average recorded investment in these impaired loans
during 2008, 2007 and 2006 was $1,952 million, $313 million
and $173 million, respectively.
When the ultimate collectibility of the total principal
of an impaired loan is in doubt, all payments are applied to
principal, under the cost recovery method. When the ultimate
collectibility of the total principal of an impaired loan is not
in doubt, contractual interest is credited to interest income
when received, under the cash basis method. Total interest
income recognized for impaired loans in 2008, 2007 and
2006 under the cash basis method was not significant.
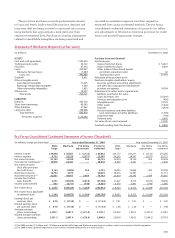
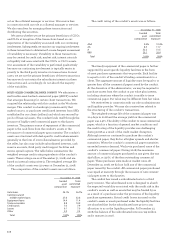
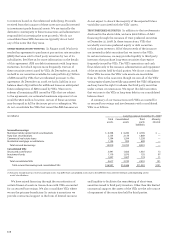
SOP -
At December 31, 2008, acquired loans within the scope of
SOP 03-3 had an unpaid principal balance (less prior charge-
offs) of $93.9 billion and a carrying value of $58.8 billion.
The following table provides details on the SOP 03-3 loans
acquired from Wachovia.
(in millions) December 31,
2008 2007
Impairment measurement based on:
Collateral value method $88 $285
Discounted cash flow method 3,552 184
Total (1)(2) $3,640 $469
(1) Includes $3,468 million and $369 million of impaired loans with a related
allowance of $816 million and $50 million at December 31, 2008 and 2007,
respectively.
(2) Wachovia loans accounted for under SOP 03-3 are not included in this table.
(in millions) December 31, 2008
Contractually required payments including interest $106,192
Nonaccretable difference (1) (41,955)
Cash flows expected to be collected (2) 64,237
Accretable yield (5,440)
Fair value of loans acquired $ 58,797
(1) Includes $37.2 billion in principal cash flows (purchase accounting adjustments)
not expected to be collected, $2.3 billion of pre-acquisition charge-offs and
$2.5 billion of future interest not expected to be collected.
(2) Represents undiscounted expected principal and interest cash flows.