Wells Fargo 2008 Annual Report Download - page 141
Download and view the complete annual report
Please find page 141 of the 2008 Wells Fargo annual report below. You can navigate through the pages in the report by either clicking on the pages listed below, or by using the keyword search tool below to find specific information within the annual report.-
 1
1 -
2
-
3
-
4
-
5
-
6
-
7
-
8
-
9
-
10
-
11
-
12
-
13
-
14
-
15
-
16
-
17
-
18
-
19
-
20
-
21
-
22
-
23
-
24
-
25
-
26
-
27
-
28
-
29
-
30
-
31
-
32
-
33
-
34
-
35
-
36
-
37
-
38
-
39
-
40
-
41
-
42
-
43
-
44
-
45
-
46
-
47
-
48
-
49
-
50
-
51
-
52
-
53
-
54
-
55
-
56
-
57
-
58
-
59
-
60
-
61
-
62
-
63
-
64
-
65
-
66
-
67
-
68
-
69
-
70
-
71
-
72
-
73
-
74
-
75
-
76
-
77
-
78
-
79
-
80
-
81
-
82
-
83
-
84
-
85
-
86
-
87
-
88
-
89
-
90
-
91
-
92
-
93
-
94
-
95
-
96
-
97
-
98
-
99
-
100
-
101
-
102
-
103
-
104
-
105
-
106
-
107
-
108
-
109
-
110
-
111
-
112
-
113
-
114
-
115
-
116
-
117
-
118
-
119
-
120
-
121
-
122
-
123
-
124
-
125
-
126
-
127
-
128
-
129
-
130
-
 131
131 -
 132
132 -
 133
133 -
 134
134 -
 135
135 -
 136
136 -
 137
137 -
 138
138 -
 139
139 -
 140
140 -
 141
141 -
 142
142 -
 143
143 -
 144
144 -
 145
145 -
 146
146 -
 147
147 -
 148
148 -
 149
149 -
 150
150 -
 151
151 -
152
-
153
-
154
-
155
-
156
-
157
-
158
-
159
-
160
-
161
-
162
-
163
-
164
-
165
-
166
-
167
-
168
-
169
-
170
-
171
-
172
 |
 |
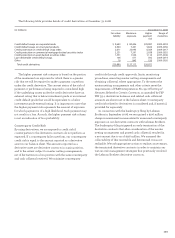
For real estate 1-4 family first and junior lien mortgages,
fair value is calculated by discounting contractual cash flows,
adjusted for prepayment and credit loss estimates, using
discount rates based on current industry pricing (where
readily available) or our own estimate of an appropriate
risk-adjusted discount rate for loans of similar size, type,
remaining maturity and repricing characteristics.
For credit card loans, the portfolio’s yield is equal to our
current pricing and, therefore, the fair value is equal to book
value adjusted for estimates of credit losses inherent in the
portfolio at the balance sheet date.
For all other consumer loans, the fair value is generally
calculated by discounting the contractual cash flows, adjusted
for prepayment and credit loss estimates, based on the
current rates we offer for loans with similar characteristics.
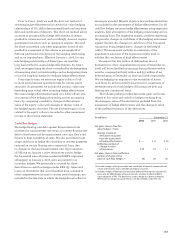
Loan commitments, standby letters of credit and
commercial and similar letters of credit are not included in
the FAS 107 table on page 143. These instruments generate
ongoing fees at our current pricing levels, which are recognized
over the term of the commitment period. In situations where
the credit quality of the counterparty to a commitment has
declined, we record a reserve. A reasonable estimate of the
fair value of these instruments is the carrying value of
deferred fees plus the related reserve. This amounted to $719
million and $33 million at December 31, 2008 and 2007,
respectively. Certain letters of credit that are hedged with
derivative instruments are carried at fair value in trading
assets or liabilities. For those letters of credit fair value is
calculated based on readily quotable credit default spreads,
using a market risk credit default swap model.
DERIVATIVES Quoted market prices are available and used
for our exchange-traded derivatives, such as certain interest
rate futures and option contracts, which we classify as Level 1.
However, substantially all of our derivatives are traded in over-
the-counter (OTC) markets where quoted market prices are not
readily available. OTC derivatives are valued using internal
valuation techniques. Valuation techniques and inputs to internally-
developed models depend on the type of derivative and nature
of the underlying rate, price or index upon which the derivative’s
value is based. Key inputs can include yield curves, credit curves,
foreign-exchange rates, prepayment rates, volatility measurements
and correlation of such inputs. Where model inputs can be
observed in a liquid market and the model does not require
significant judgment, such derivatives are typically classified
as Level 2 of the fair value hierarchy. Examples of derivatives
classified as Level 2 include generic interest rate swaps, foreign
currency swaps, commodity swaps, and option contracts. When
instruments are traded in less liquid markets and significant
inputs are unobservable, such derivatives are classified within
Level 3. Examples of derivatives classified as Level 3 include
complex and highly structured derivatives, credit default swaps,
interest rate lock commitments written for our residential mort-
gage loans that we intend to sell and long dated equity options
where volatility is not observable. Additionally, significant
judgments are required when classifying financial instruments
within the fair value hierarchy, particularly between Level 2 and
3, as is the case for certain derivatives.
MORTGAGE SERVICING RIGHTS AND CERTAIN OTHER INTERESTS
HELD IN SECURITIZATIONS Mortgage servicing rights (MSRs)
and certain other interests held in securitizations (e.g.,
interest-only strips) do not trade in an active market with
readily observable prices. Accordingly, we determine the fair
value of MSRs using a valuation model that calculates the
present value of estimated future net servicing income. The
model incorporates assumptions that market participants
use in estimating future net servicing income, including
estimates of prepayment speeds (including housing price
volatility), discount rate, cost to service (including delinquency
and foreclosure costs), escrow account earnings, contractual
servicing fee income, ancillary income and late fees.
Commercial MSRs are carried at lower of cost or market value,
and therefore can be subject to fair value measurements on a
nonrecurring basis. For other interests held in securitizations
(such as interest-only strips) we use a valuation model that
calculates the present value of estimated future cash flows.
The model incorporates our own estimates of assumptions
market participants use in determining the fair value, including
estimates of prepayment speeds, discount rates, defaults and
contractual fee income. Interest-only strips are recorded as
trading assets. Fair value measurements of our MSRs and
interest-only strips use significant unobservable inputs and,
accordingly, we classify as Level 3. We may also retain
securities from our loan securitization activities. The valuation
technique for these securities is discussed in Securities
available for sale.
FORECLOSED ASSETS Foreclosed assets include foreclosed
properties securing residential, auto and GNMA loans.
Foreclosed assets are adjusted to fair value less costs to sell
upon transfer of the loans to foreclosed assets. Subsequently,
foreclosed assets are carried at the lower of carrying value or
fair value less costs to sell. Fair value is generally based upon
independent market prices or appraised values of the collateral
and, accordingly, we classify foreclosed assets as Level 2.
NONMARKETABLE EQUITY INVESTMENTS Nonmarketable equity
investments are recorded under the cost or equity method of
accounting. Nonmarketable equity securities that fall within
the scope of the AICPA Investment Company Audit Guide
are carried at fair value (principal investments). There are
generally restrictions on the sale and/or liquidation of these
investments, including federal bank stock. Federal bank stock
carrying value approximates fair value. We use facts and
circumstances available to estimate the fair value of our
nonmarketable equity investments. We typically consider our
access to and need for capital (including recent or projected
financing activity), qualitative assessments of the viability
of the investee, evaluation of the financial statements of the
investee and prospects for its future. Principal investments,
including certain public equity and non-public securities
and certain investments in private equity funds, are recorded
at fair value with realized and unrealized gains and losses
included in gains and losses on equity investments in the
income statement, and are included in other assets on
the balance sheet. Public equity investments are valued