Wells Fargo 2008 Annual Report Download - page 163
Download and view the complete annual report
Please find page 163 of the 2008 Wells Fargo annual report below. You can navigate through the pages in the report by either clicking on the pages listed below, or by using the keyword search tool below to find specific information within the annual report.-
 1
1 -
2
-
3
-
4
-
5
-
6
-
7
-
8
-
9
-
10
-
11
-
12
-
13
-
14
-
15
-
16
-
17
-
18
-
19
-
20
-
21
-
22
-
23
-
24
-
25
-
26
-
27
-
28
-
29
-
30
-
31
-
32
-
33
-
34
-
35
-
36
-
37
-
38
-
39
-
40
-
41
-
42
-
43
-
44
-
45
-
46
-
47
-
48
-
49
-
50
-
51
-
52
-
53
-
54
-
55
-
56
-
57
-
58
-
59
-
60
-
61
-
62
-
63
-
64
-
65
-
66
-
67
-
68
-
69
-
70
-
71
-
72
-
73
-
74
-
75
-
76
-
77
-
78
-
79
-
80
-
81
-
82
-
83
-
84
-
85
-
86
-
87
-
88
-
89
-
90
-
91
-
92
-
93
-
94
-
95
-
96
-
97
-
98
-
99
-
100
-
101
-
102
-
103
-
104
-
105
-
106
-
107
-
108
-
109
-
110
-
111
-
112
-
113
-
114
-
115
-
116
-
117
-
118
-
119
-
120
-
121
-
122
-
123
-
124
-
125
-
126
-
127
-
128
-
129
-
130
-
131
-
132
-
133
-
134
-
135
-
136
-
137
-
138
-
139
-
140
-
141
-
142
-
143
-
144
-
145
-
146
-
147
-
148
-
149
-
150
-
151
-
152
-
 153
153 -
 154
154 -
 155
155 -
 156
156 -
 157
157 -
 158
158 -
 159
159 -
 160
160 -
 161
161 -
 162
162 -
 163
163 -
 164
164 -
 165
165 -
 166
166 -
 167
167 -
 168
168 -
 169
169 -
 170
170 -
 171
171 -
 172
172
 |
 |

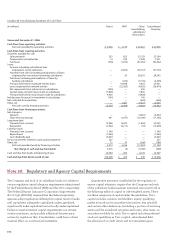
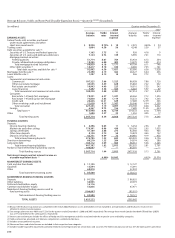
Condensed Consolidating Statements of Cash Flows
(in millions) Year ended December 31,
2008 2007
Parent WFFI Other Consolidated Parent WFFI Other Consolidated
consolidating Company consolidating Company
subsidiaries/ subsidiaries/
eliminations eliminations
Cash flows from
operating activities:
Net cash provided (used)
by operating activities $ 730 $ 2,023 $ (7,584)$ (4,831)$ 3,715 $ 1,446 $ 3,917 $ 9,078
Cash flows from
investing activities:
Securities available for sale:
Sales proceeds 2,570 875 57,361 60,806 2,554 559 44,877 47,990
Prepayments and maturities — 283 24,034 24,317 — 299 8,206 8,505
Purchases (3,514) (1,258) (100,569) (105,341) (3,487) (1,174) (70,468) (75,129)
Loans:
Increase in banking
subsidiaries’ loan originations,
net of collections — (1,684) (53,131) (54,815) — (2,686) (45,929) (48,615)
Proceeds from sales (including
participations) of loans
originated for investment
by banking subsidiaries — — 1,988 1,988 — — 3,369 3,369
Purchases (including
participations) of loans
by banking subsidiaries — — (5,513) (5,513) — — (8,244) (8,244)
Principal collected on
nonbank entities’ loans — 14,447 7,399 21,846 — 18,729 2,747 21,476
Loans originated by
nonbank entities — (12,362) (7,611) (19,973) — (20,461) (4,823) (25,284)
Net repayments from
(advances to) subsidiaries (12,415) — 12,415 — (10,338) — 10,338 —
Capital notes and term loans
made to subsidiaries (2,008) — 2,008 — (10,508) — 10,508 —
Principal collected on notes/
loans made to subsidiaries 8,679 — (8,679) — 7,588 — (7,588) —
Net decrease (increase) in
investment in subsidiaries (37,108) — 37,108 — (1,132) — 1,132 —
Net cash acquired from acquisitions 9,194 — 2,009 11,203 — — (2,811) (2,811)
Other, net (21,823) (91) 69,225 47,311 (106) (847) 2,381 1,428
Net cash provided (used)
by investing activities (56,425) 210 38,044 (18,171) (15,429) (5,581) (56,305) (77,315)
Cash flows from
financing activities:
Net change in:
Deposits — — 7,697 7,697 — — 27,058 27,058
Short-term borrowings 17,636 5,580 (38,104) (14,888) 9,138 2,670 28,019 39,827
Long-term debt:
Proceeds from issuance 21,931 1,113 12,657 35,701 24,385 11,335 (6,360) 29,360
Repayment (16,560) (8,983) (4,316) (29,859) (11,726) (9,870) 3,346 (18,250)
Common stock:
Proceeds from issuance 14,171 — — 14,171 1,876 — — 1,876
Repurchased (1,623) — — (1,623) (7,418) — — (7,418)
Cash dividends paid (4,312) — — (4,312) (3,955) — — (3,955)
Preferred stock:
Proceeds from issuance 22,674 — — 22,674 ————
Proceeds from issuance of
stock warrants 2,326 — — 2,326 ————
Excess tax benefits related to
stock option payments 121 — — 121 196 — — 196
Other, net — — — — (2) 13 (739) (728)
Net cash provided (used)
by financing activities 56,364 (2,290) (22,066) 32,008 12,494 4,148 51,324 67,966
Net change in cash
and due from banks 669 (57) 8,394 9,006 780 13 (1,064) (271)
Cash and due from banks
at beginning of year 14,989 483 (715) 14,757 14,209 470 349 15,028
Cash and due from banks
at end of year $ 15,658 $ 426 $ 7,679 $ 23,763 $ 14,989 $ 483 $ (715) $ 14,757