Wells Fargo 2008 Annual Report Download - page 122
Download and view the complete annual report
Please find page 122 of the 2008 Wells Fargo annual report below. You can navigate through the pages in the report by either clicking on the pages listed below, or by using the keyword search tool below to find specific information within the annual report.-
 1
1 -
2
-
3
-
4
-
5
-
6
-
7
-
8
-
9
-
10
-
11
-
12
-
13
-
14
-
15
-
16
-
17
-
18
-
19
-
20
-
21
-
22
-
23
-
24
-
25
-
26
-
27
-
28
-
29
-
30
-
31
-
32
-
33
-
34
-
35
-
36
-
37
-
38
-
39
-
40
-
41
-
42
-
43
-
44
-
45
-
46
-
47
-
48
-
49
-
50
-
51
-
52
-
53
-
54
-
55
-
56
-
57
-
58
-
59
-
60
-
61
-
62
-
63
-
64
-
65
-
66
-
67
-
68
-
69
-
70
-
71
-
72
-
73
-
74
-
75
-
76
-
77
-
78
-
79
-
80
-
81
-
82
-
83
-
84
-
85
-
86
-
87
-
88
-
89
-
90
-
91
-
92
-
93
-
94
-
95
-
96
-
97
-
98
-
99
-
100
-
101
-
102
-
103
-
104
-
105
-
106
-
107
-
108
-
109
-
110
-
111
-
 112
112 -
 113
113 -
 114
114 -
 115
115 -
 116
116 -
 117
117 -
 118
118 -
 119
119 -
 120
120 -
 121
121 -
 122
122 -
 123
123 -
 124
124 -
 125
125 -
 126
126 -
 127
127 -
 128
128 -
 129
129 -
 130
130 -
 131
131 -
 132
132 -
133
-
134
-
135
-
136
-
137
-
138
-
139
-
140
-
141
-
142
-
143
-
144
-
145
-
146
-
147
-
148
-
149
-
150
-
151
-
152
-
153
-
154
-
155
-
156
-
157
-
158
-
159
-
160
-
161
-
162
-
163
-
164
-
165
-
166
-
167
-
168
-
169
-
170
-
171
-
172
 |
 |

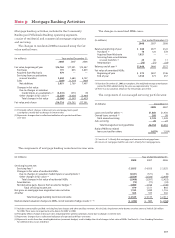
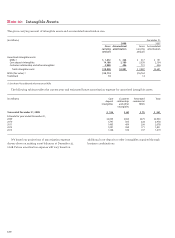
The gross carrying amount of intangible assets and accumulated amortization was:
Note 10: Intangible Assets
The following table provides the current year and estimated future amortization expense for amortized intangible assets.
We based our projections of amortization expense
shown above on existing asset balances at December 31,
2008. Future amortization expense will vary based on
(in millions) December 31,
2008 2007
Gross Accumulated Gross Accumulated
carrying amortization carrying amortization
amount amount
Amortized intangible assets:
MSRs
(1)
$ 1,672 $ 226 $ 617 $ 151
Core deposit intangibles 14,188 2,189 2,539 2,104
Customer relationship and other intangibles 3,988 486 731 426
Total intangible assets $19,848 $2,901 $ 3,887 $2,681
MSRs (fair value)
(1)
$14,714 $16,763
Trademark 14 14
(1) See Note 9 for additional information on MSRs.
(in millions) Core Customer Amortized Total
deposit relationship commercial
intangibles and other MSRs
intangibles
Year ended December 31, 2008 $ 126 $ 60 $ 75 $ 261
Estimate for year ended December 31,
2009 $2,005 $650 $275 $2,930
2010 1,747 503 228 2,478
2011 1,463 409 206 2,078
2012 1,291 369 171 1,831
2013 1,148 334 137 1,619
additional core deposit or other intangibles acquired through
business combinations.