Wells Fargo 2008 Annual Report Download - page 121
Download and view the complete annual report
Please find page 121 of the 2008 Wells Fargo annual report below. You can navigate through the pages in the report by either clicking on the pages listed below, or by using the keyword search tool below to find specific information within the annual report.-
 1
1 -
2
-
3
-
4
-
5
-
6
-
7
-
8
-
9
-
10
-
11
-
12
-
13
-
14
-
15
-
16
-
17
-
18
-
19
-
20
-
21
-
22
-
23
-
24
-
25
-
26
-
27
-
28
-
29
-
30
-
31
-
32
-
33
-
34
-
35
-
36
-
37
-
38
-
39
-
40
-
41
-
42
-
43
-
44
-
45
-
46
-
47
-
48
-
49
-
50
-
51
-
52
-
53
-
54
-
55
-
56
-
57
-
58
-
59
-
60
-
61
-
62
-
63
-
64
-
65
-
66
-
67
-
68
-
69
-
70
-
71
-
72
-
73
-
74
-
75
-
76
-
77
-
78
-
79
-
80
-
81
-
82
-
83
-
84
-
85
-
86
-
87
-
88
-
89
-
90
-
91
-
92
-
93
-
94
-
95
-
96
-
97
-
98
-
99
-
100
-
101
-
102
-
103
-
104
-
105
-
106
-
107
-
108
-
109
-
110
-
 111
111 -
 112
112 -
 113
113 -
 114
114 -
 115
115 -
 116
116 -
 117
117 -
 118
118 -
 119
119 -
 120
120 -
 121
121 -
 122
122 -
 123
123 -
 124
124 -
 125
125 -
 126
126 -
 127
127 -
 128
128 -
 129
129 -
 130
130 -
 131
131 -
132
-
133
-
134
-
135
-
136
-
137
-
138
-
139
-
140
-
141
-
142
-
143
-
144
-
145
-
146
-
147
-
148
-
149
-
150
-
151
-
152
-
153
-
154
-
155
-
156
-
157
-
158
-
159
-
160
-
161
-
162
-
163
-
164
-
165
-
166
-
167
-
168
-
169
-
170
-
171
-
172
 |
 |

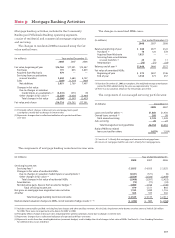
Mortgage banking activities, included in the Community
Banking and Wholesale Banking operating segments,
consist of residential and commercial mortgage originations
and servicing.
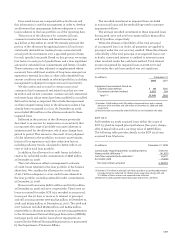
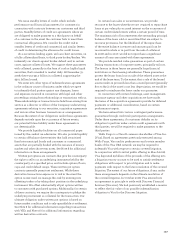
The changes in residential MSRs measured using the fair
value method were:
Note 9: Mortgage Banking Activities
(in millions) Year ended December 31,
2008 2007 2006
Fair value, beginning of year $16,763 $17,591 $12,547
Purchases 191 803 3,859
Acquired from Wachovia 479 ——
Servicing from securitizations
or asset transfers 3,450 3,680 4,107
Sales (269) (1,714) (469)
Net additions 3,851 2,769 7,497
Changes in fair value:
Due to changes in valuation
model inputs or assumptions (1) (3,341) (571) (9)
Other changes in fair value (2) (2,559) (3,026) (2,444)
Total changes in fair value (5,900) (3,597) (2,453)
Fair value, end of year $14,714 $16,763 $17,591
(1) Principally reflects changes in discount rates and prepayment speed
assumptions, mostly due to changes in interest rates.
(2) Represents changes due to collection/realization of expected cash flows
over time.
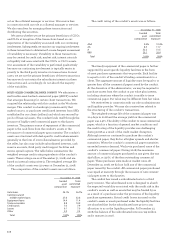
(in millions) Year ended December 31,
2008 2007 2006
Balance, beginning of year $ 466 $377 $122
Purchases (1) 10 120 278
Acquired from Wachovia 1,021 ——
Servicing from securitizations
or asset transfers (1) 24 40 11
Amortization (75) (71) (34)
Balance, end of year (2) $1,446 $466 $377
Fair value of amortized MSRs:
Beginning of year $ 573 $457 $146
End of year 1,555 573 457
(1) Based on December 31, 2008, assumptions, the weighted-average amortization
period for MSRs added during the year was approximately 7.6 years.
(2) There was no valuation allowance for the periods presented.
The changes in amortized MSRs were:
(in billions) December 31,
2008 2007
Loans serviced for others (1) $1,860 $1,430
Owned loans serviced (2) 268 98
Total owned servicing 2,128 1,528
Sub-servicing 26 23
Total managed servicing portfolio $2,154 $1,551
Ratio of MSRs to related
loans serviced for others 0.87% 1.20%
(1) Consists of 1-4 family first mortgage and commercial mortgage loans.
(2) Consists of mortgages held for sale and 1-4 family first mortgage loans.
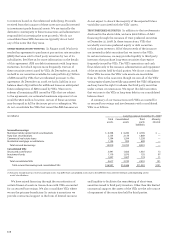
The components of our managed servicing portfolio were:
(in millions) Year ended December 31,
2008 2007 2006
Servicing income, net:
Servicing fees (1) $ 3,855 $ 4,025 $ 3,525
Changes in fair value of residential MSRs:
Due to changes in valuation model inputs or assumptions (2) (3,341) (571) (9)
Other changes in fair value (3) (2,559) (3,026) (2,444)
Total changes in fair value of residential MSRs (5,900) (3,597) (2,453)
Amortization (75) (71) (34)
Net derivative gains (losses) from economic hedges (4) 3,099 1,154 (145)
Total servicing income, net 979 1,511 893
Net gains on mortgage loan origination/sales activities 1,183 1,289 1,116
All other 363 333 302
Total mortgage banking noninterest income $ 2,525 $ 3,133 $ 2,311
Market-related valuation changes to MSRs, net of economic hedge results (2) + (4) $ (242) $ 583 $ (154)
(1) Includes contractually specified servicing fees, late charges and other ancillary revenues. Also includes impairment write-downs on other interests held of $26 million
for 2006. There were no impairment write-downs for 2007 or 2008.
(2) Principally reflects changes in discount rates and prepayment speed assumptions, mostly due to changes in interest rates.
(3) Represents changes due to collection/realization of expected cash flows over time.
(4) Represents results from free-standing derivatives (economic hedges) used to hedge the risk of changes in fair value of MSRs. See Note 16 – Free-Standing Derivatives
for additional discussion and detail.
The components of mortgage banking noninterest income were: