Wells Fargo 2008 Annual Report Download - page 143
Download and view the complete annual report
Please find page 143 of the 2008 Wells Fargo annual report below. You can navigate through the pages in the report by either clicking on the pages listed below, or by using the keyword search tool below to find specific information within the annual report.
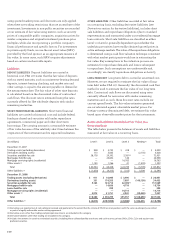
The changes in Level 3 assets and liabilities measured at fair value on a recurring basis are summarized as follows:
(in millions) Trading Securities Mortgages Mortgage Net Other Other
assets available held for servicing derivative assets liabilities
(excluding for sale sale rights assets and (excluding (excluding
derivatives) (residential) liabilities derivatives) derivatives)
Balance, December 31, 2006 $ 360 $ 3,447 $ — $ 17,591 $ (68) $ — $ (282)
Total net gains (losses) for
2007 included in:
Net income (151) (33) 1 (3,597) (108) — (97)
Other comprehensive income —(12)—————
Purchases, sales, issuances and
settlements, net 207 1,979 30 2,769 178 — 99
Net transfers into Level 3 (1) 2 — 115(4) — 4 — —
Balance, December 31, 2007 418 5,381 146 16,763 6 — (280)
Total net gains (losses) for
2008 included in:
Net income (115) (347) (280) (5,900) (275) — (228)
Other comprehensive income — (1,489) — — 1 — —
Purchases, sales, issuances and
settlements, net 3,197 17,216 561 3,878 303 1,231 (130)
Net transfers into Level 3 (1) — 1,941(4) 4,291(4) —2——
Other (5) (10) — (27) — — —
Balance, December 31, 2008 $3,495 $22,692 $4,718 $14,714 $ 37 $1,231 $(638)
Net unrealized gains (losses)
included in net income for 2007
relating to assets and liabilities
held at December 31, 2007 (2) $ (86)(3) $ (31) $ 1(5) $ (594)(5)(6) $6
(5) $— $ (98)(5)
Net unrealized gains (losses)
included in net income for 2008
relating to assets and liabilities
held at December 31, 2008 (2) $ (23)(3) $ (150) $ (268)(5) $ (3,333)(5)(7) $93
(5) $ — $(228)(5)
(1) The amounts presented as transfers into and out of Level 3 represent the fair value as of the beginning of the period presented.
(2) Represents only net gains (losses) that are due to changes in economic conditions and management’s estimates of fair value and excludes changes due to the
collection/realization of cash flows over time.
(3) Included in other noninterest income in the income statement.
(4) Represents transfers from Level 2 of residential MHFS and debt securities (including CDOs) for which significant inputs to the valuation became unobservable,
largely due to reduced levels of market liquidity. Related gains and losses for the period are included in the above table.
(5) Included in mortgage banking in the income statement.
(6) Represents total unrealized losses of $571 million, net of gains of $23 million related to sales.
(7) Represents total unrealized losses of $3,341 million, net of losses of $8 million related to sales.
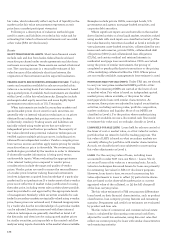
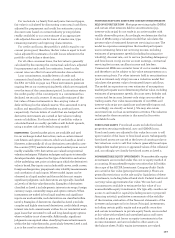
We continue to invest in asset-backed securities
collateralized by auto leases and cash reserves that provide
attractive yields and are structured equivalent to investment-
grade securities. Based on our experience with underwriting
auto leases and the significant overcollateralization of our
interests, which results in retention by the counterparty of
a significant amount of the primary risks of the investments
(credit risk and residual value risk of the autos), we consider
these assets to be of high credit quality. The securities are
relatively short duration, therefore not as sensitive to market
interest rate movements.
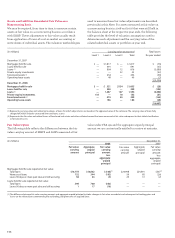
For certain assets and liabilities, we obtain fair value
measurements from independent brokers or independent
third party pricing services. The detail by level is shown
in the table below.
(in millions) December 31, 2008
Independent brokers Third party pricing services
Level 1 Level 2 Level 3 Level 1 Level 2 Level 3
Trading assets (excluding derivatives) $ 190 $3,272 $ 12 $ 917 $ 1,944 $110
Derivatives (trading assets) 3,419 106 106 605 4,635 —
Securities available for sale 181 8,916 1,681 3,944 109,170 8
Loans held for sale — 1 — — 353 —
Other liabilities
1,105
175 128 2,208 5,171 1


