Wells Fargo 2008 Annual Report Download - page 50
Download and view the complete annual report
Please find page 50 of the 2008 Wells Fargo annual report below. You can navigate through the pages in the report by either clicking on the pages listed below, or by using the keyword search tool below to find specific information within the annual report.-
 1
1 -
2
-
3
-
4
-
5
-
6
-
7
-
8
-
9
-
10
-
11
-
12
-
13
-
14
-
15
-
16
-
17
-
18
-
19
-
20
-
21
-
22
-
23
-
24
-
25
-
26
-
27
-
28
-
29
-
30
-
31
-
32
-
33
-
34
-
35
-
36
-
37
-
38
-
39
-
 40
40 -
 41
41 -
 42
42 -
 43
43 -
 44
44 -
 45
45 -
 46
46 -
 47
47 -
 48
48 -
 49
49 -
 50
50 -
 51
51 -
 52
52 -
 53
53 -
 54
54 -
 55
55 -
 56
56 -
 57
57 -
 58
58 -
 59
59 -
 60
60 -
61
-
62
-
63
-
64
-
65
-
66
-
67
-
68
-
69
-
70
-
71
-
72
-
73
-
74
-
75
-
76
-
77
-
78
-
79
-
80
-
81
-
82
-
83
-
84
-
85
-
86
-
87
-
88
-
89
-
90
-
91
-
92
-
93
-
94
-
95
-
96
-
97
-
98
-
99
-
100
-
101
-
102
-
103
-
104
-
105
-
106
-
107
-
108
-
109
-
110
-
111
-
112
-
113
-
114
-
115
-
116
-
117
-
118
-
119
-
120
-
121
-
122
-
123
-
124
-
125
-
126
-
127
-
128
-
129
-
130
-
131
-
132
-
133
-
134
-
135
-
136
-
137
-
138
-
139
-
140
-
141
-
142
-
143
-
144
-
145
-
146
-
147
-
148
-
149
-
150
-
151
-
152
-
153
-
154
-
155
-
156
-
157
-
158
-
159
-
160
-
161
-
162
-
163
-
164
-
165
-
166
-
167
-
168
-
169
-
170
-
171
-
172
 |
 |

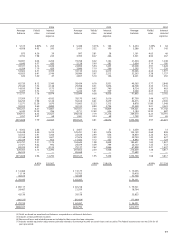
Table 3: Average Balances, Yields and Rates Paid (Taxable-Equivalent Basis) (1)(2)(3)
(in millions) 2008 2007
Average Yields/ Interest Average Yields/ Interest
balance rates income/ balance rates income/
expense expense
EARNING ASSETS
Federal funds sold, securities purchased under
resale agreements and other short-term investments $ 5,293 1.71% $ 90 $ 4,468 4.99% $ 223
Trading assets 4,971 3.80 189 4,291 4.37 188
Debt securities available for sale
(4)
:
Securities of U.S. Treasury and federal agencies 1,083 3.84 41 848 4.26 36
Securities of U.S. states and political subdivisions 6,918 6.83 501 4,740 7.37 342
Mortgage-backed securities:
Federal agencies 44,777 5.97 2,623 38,592 6.10 2,328
Private collateralized mortgage obligations 20,749 6.04 1,412 6,548 6.12 399
Total mortgage-backed securities 65,526 5.99 4,035 45,140 6.10 2,727
Other debt securities (5) 12,818 7.17 1,000 6,295 7.52 477
Total debt securities available for sale
(5)
86,345 6.22 5,577 57,023 6.34 3,582
Mortgages held for sale (6) 25,656 6.13 1,573 33,066 6.50 2,150
Loans held for sale (6) 837 5.69 48 896 7.76 70
Loans:
Commercial and commercial real estate:
Commercial 98,620 6.12 6,034 77,965 8.17 6,367
Other real estate mortgage 41,659 5.80 2,416 32,722 7.38 2,414
Real estate construction 19,453 5.08 988 16,934 7.80 1,321
Lease financing 7,141 5.62 401 5,921 5.84 346
Total commercial and commercial real estate 166,873 5.90 9,839 133,542 7.82 10,448
Consumer:
Real estate 1-4 family first mortgage 75,116 6.67 5,008 61,527 7.25 4,463
Real estate 1-4 family junior lien mortgage 75,375 6.55 4,934 72,075 8.12 5,851
Credit card 19,601 12.13 2,378 15,874 13.58 2,155
Other revolving credit and installment 54,368 8.72 4,744 54,436 9.71 5,285
Total consumer 224,460 7.60 17,064 203,912 8.71 17,754
Foreign 7,127 10.50 748 7,321 11.68 855
Total loans (6) 398,460 6.94 27,651 344,775 8.43 29,057
Other 1,920 4.73 91 1,402 5.07 71
Total earning assets $523,482 6.69 35,219 $445,921 7.93 35,341
FUNDING SOURCES
Deposits:
Interest-bearing checking $ 5,650 1.12 64 $ 5,057 3.16 160
Market rate and other savings 166,691 1.32 2,195 147,939 2.78 4,105
Savings certificates 39,481 3.08 1,215 40,484 4.38 1,773
Other time deposits 6,656 2.83 187 8,937 4.87 435
Deposits in foreign offices 47,578 1.81 860 36,761 4.57 1,679
Total interest-bearing deposits 266,056 1.70 4,521 239,178 3.41 8,152
Short-term borrowings 65,826 2.25 1,478 25,854 4.81 1,245
Long-term debt 102,283 3.70 3,789 93,193 5.18 4,824
Total interest-bearing liabilities 434,165 2.25 9,788 358,225 3.97 14,221
Portion of noninterest-bearing funding sources 89,317 — — 87,696 — —
Total funding sources $523,482 1.86 9,788 $445,921 3.19 14,221
Net interest margin and net interest income on
a taxable-equivalent basis (7) 4.83% $25,431 4.74% $21,120
NONINTEREST-EARNING ASSETS
Cash and due from banks $ 11,175 $ 11,806
Goodwill 13,353 11,957
Other 56,386 51,068
Total noninterest-earning assets $ 80,914 $ 74,831
NONINTEREST-BEARING FUNDING SOURCES
Deposits $ 87,820 $ 88,907
Other liabilities 28,939 26,557
Preferred stockholders’ equity 4,051 —
Common stockholders’ equity 49,421 47,063
Noninterest-bearing funding sources used to
fund earning assets (89,317) (87,696)
Net noninterest-bearing funding sources $ 80,914 $ 74,831
TOTAL ASSETS $604,396 $520,752
(1) Because the Wachovia acquisition was completed at the end of 2008, Wachovia's assets and liabilities are not included in average balances, and Wachovia's
results are not reflected in interest income/expense.
(2) Our average prime rate was 5.09%, 8.05%, 7.96%, 6.19% and 4.34% for 2008, 2007, 2006, 2005 and 2004, respectively. The average three-month London Interbank
Offered Rate (LIBOR) was 2.93%, 5.30%, 5.20%, 3.56% and 1.62% for the same years, respectively.
(3) Interest rates and amounts include the effects of hedge and risk management activities associated with the respective asset and liability categories.