Wells Fargo 2008 Annual Report Download - page 58
Download and view the complete annual report
Please find page 58 of the 2008 Wells Fargo annual report below. You can navigate through the pages in the report by either clicking on the pages listed below, or by using the keyword search tool below to find specific information within the annual report.
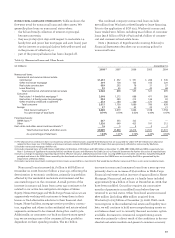
Our significant continuing involvement with QSPEs and
unconsolidated VIEs as of December 31, 2008 and 2007, is
presented below.
We have excluded from the table SPEs and unconsolidated
VIEs where our only involvement is in the form of invest-
ments in trading securities, investments in securities or loans
underwritten by third parties, and administrative or trustee
services. We have also excluded investments accounted for
in accordance with the AICPA Investment Company Audit
Guide, investments accounted for under the cost method and
investments accounted for under the equity method.
For more information on securitizations, including sales
proceeds and cash flows from securitizations, see Note 8
(Securitizations and Variable Interest Entities) to Financial
Statements.
We also have significant involvement with voting interest
SPEs. Wells Fargo Home Mortgage (Home Mortgage), in the
ordinary course of business, originates a portion of its mort-
gage loans through unconsolidated joint ventures in which
we own an interest of 50% or less. Loans made by these joint
ventures are funded by Wells Fargo Bank, N.A. through an
established line of credit and are subject to specified under-
writing criteria. At December 31, 2008, the total assets of
these mortgage origination joint ventures were approximate-
ly $46 million. We provide liquidity to these joint ventures in
the form of outstanding lines of credit and, at December 31,
2008, these liquidity commitments totaled $135 million.
We also hold interests in other unconsolidated joint ven-
tures formed with unrelated third parties to provide efficien-
cies from economies of scale. A third party manages our real
estate lending services joint ventures and provides customers
with title, escrow, appraisal and other real estate related ser-
vices. Our fraud prevention services partnership facilitates
the exchange of information between financial services orga-
nizations to detect and prevent fraud. At December 31, 2008,
total assets of our real estate lending joint ventures and fraud
prevention services partnership were approximately $132 million.
Guarantees and Certain Contingent Arrangements
Guarantees are contracts that contingently require us to
make payments to a guaranteed party based on an event
or a change in an underlying asset, liability, rate or index.
Guarantees are generally in the form of securities lending
indemnifications, standby letters of credit, liquidity agree-
ments, recourse obligations, residual value guarantees, writ-
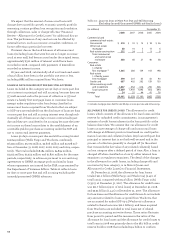
ten put options and contingent consideration. The following
table presents the carrying amount, maximum risk of loss of
our guarantees and, for December 31, 2008, the amount with a
higher payment risk.
Table 12: Guarantees and Certain Contingent Arrangements
(in millions) December 31,
2008 2007
Carrying Maximum Higher Carrying Maximum
amount risk of payment amount risk of
loss risk loss
Standby letters of credit $ 130 $ 47,191 $17,293 $ 7 $12,530
Securities and other lending indemnifications — 30,120 1,907 ——
Liquidity agreements 30 17,602 — ——
Written put options 1,376 10,182 5,314 48 2,569
Loans sold with recourse 53 6,126 2,038 —2
Residual value guarantees — 1,121 — ——
Contingent consideration 11 187 — 67 246
Other guarantees — 38 — 1 59
Total guarantees $1,600 $112,567 $26,552 $123 $15,406
Table 11: Qualifying Special Purpose Entities and Unconsolidated
Variable Interest Entities
(in millions) December 31, 2008
Total Carrying Maximum
entity value exposure
assets to loss
QSPEs
Residential mortgage
loan securitizations $1,144,775 $29,939 $31,438
Commercial mortgage
securitizations 355,267 3,060 6,376
Student loan securitizations 2,765 133 133
Auto loan securitizations 4,133 115 115
Other 11,877 71 1,576
Total QSPEs $1,518,817 $33,318 $39,638
Unconsolidated VIEs
CDOs $ 48,802 $15,133 $20,443
Wachovia administered
ABCP (1) conduit 10,767 — 15,824
Asset-based lending structures 11,614 9,096 9,482
Tax credit structures 22,882 3,850 4,926
CLOs 23,339 3,326 3,881
Investment funds 105,808 3,543 3,690
Credit-linked note structures 12,993 1,522 2,303
Money market funds 31,843 60 101
Other 1,832 3,806 4,699
Total unconsolidated VIEs $ 269,880 $40,336 $65,349
(1) Asset-backed commercial paper
For more information on guarantees and certain contingent arrangements, see Note 15 (Guarantees and Legal Actions)
to Financial Statements.


