Wells Fargo 2008 Annual Report Download - page 64
Download and view the complete annual report
Please find page 64 of the 2008 Wells Fargo annual report below. You can navigate through the pages in the report by either clicking on the pages listed below, or by using the keyword search tool below to find specific information within the annual report.-
 1
1 -
2
-
3
-
4
-
5
-
6
-
7
-
8
-
9
-
10
-
11
-
12
-
13
-
14
-
15
-
16
-
17
-
18
-
19
-
20
-
21
-
22
-
23
-
24
-
25
-
26
-
27
-
28
-
29
-
30
-
31
-
32
-
33
-
34
-
35
-
36
-
37
-
38
-
39
-
40
-
41
-
42
-
43
-
44
-
45
-
46
-
47
-
48
-
49
-
50
-
51
-
52
-
53
-
 54
54 -
 55
55 -
 56
56 -
 57
57 -
 58
58 -
 59
59 -
 60
60 -
 61
61 -
 62
62 -
 63
63 -
 64
64 -
 65
65 -
 66
66 -
 67
67 -
 68
68 -
 69
69 -
 70
70 -
 71
71 -
 72
72 -
 73
73 -
 74
74 -
75
-
76
-
77
-
78
-
79
-
80
-
81
-
82
-
83
-
84
-
85
-
86
-
87
-
88
-
89
-
90
-
91
-
92
-
93
-
94
-
95
-
96
-
97
-
98
-
99
-
100
-
101
-
102
-
103
-
104
-
105
-
106
-
107
-
108
-
109
-
110
-
111
-
112
-
113
-
114
-
115
-
116
-
117
-
118
-
119
-
120
-
121
-
122
-
123
-
124
-
125
-
126
-
127
-
128
-
129
-
130
-
131
-
132
-
133
-
134
-
135
-
136
-
137
-
138
-
139
-
140
-
141
-
142
-
143
-
144
-
145
-
146
-
147
-
148
-
149
-
150
-
151
-
152
-
153
-
154
-
155
-
156
-
157
-
158
-
159
-
160
-
161
-
162
-
163
-
164
-
165
-
166
-
167
-
168
-
169
-
170
-
171
-
172
 |
 |

We also have in place proactive steps to work with
customers to refinance or restructure their Pick-a-Pay
loans into other loan products. For customers at-risk, we
will offer combinations of term extensions of up to 40 years,
interest rate reductions, charge no interest on a portion
of the principal for some period of time and, in geographies
with substantial property value declines, we will even use
permanent principal reductions.
We expect to continually reassess our loss mitigation
strategies and may adopt additional strategies in the future.
To the extent that these strategies involve making an economic
concession to a customer experiencing financial difficulty,
they will be accounted for and reported as TDRs.
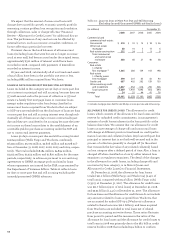
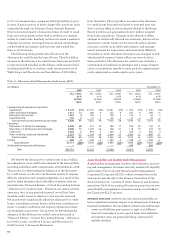
Table 16: Pick-a-Pay Portfolio
(in millions) December 31, 2008
SOP 03-3 loans All other loans
Outstanding Current Carrying Ratio of Outstanding Current
balance (1) LTV ratio (2) amount carrying balance LTV ratio (2)
amount
to current
value
California $42,650 133% $25,472 85% $28,107 86%
Florida 5,992 119 3,439 76 6,099 89
New Jersey 1,809 94 1,246 60 3,545 74
Texas 562 72 385 49 2,231 61
Arizona 1,552 133 895 85 1,449 95
Other states 9,381 92 6,178 61 16,269 75
Total Pick-a-Pay loans $61,946 $37,615 $57,700
(1) Outstanding balances exclude purchase accounting nonaccretable difference of $(24.3) billion; include accretable yield.
(2) Current LTV ratio is based on collateral values and is updated quarterly by an independent vendor. LTV ratio includes outstanding balance on equity lines of credit
(included in Table 15) that share common collateral and are junior to the above Pick-a-Pay loans.