Wells Fargo 2008 Annual Report Download - page 65
Download and view the complete annual report
Please find page 65 of the 2008 Wells Fargo annual report below. You can navigate through the pages in the report by either clicking on the pages listed below, or by using the keyword search tool below to find specific information within the annual report.-
 1
1 -
2
-
3
-
4
-
5
-
6
-
7
-
8
-
9
-
10
-
11
-
12
-
13
-
14
-
15
-
16
-
17
-
18
-
19
-
20
-
21
-
22
-
23
-
24
-
25
-
26
-
27
-
28
-
29
-
30
-
31
-
32
-
33
-
34
-
35
-
36
-
37
-
38
-
39
-
40
-
41
-
42
-
43
-
44
-
45
-
46
-
47
-
48
-
49
-
50
-
51
-
52
-
53
-
54
-
 55
55 -
 56
56 -
 57
57 -
 58
58 -
 59
59 -
 60
60 -
 61
61 -
 62
62 -
 63
63 -
 64
64 -
 65
65 -
 66
66 -
 67
67 -
 68
68 -
 69
69 -
 70
70 -
 71
71 -
 72
72 -
 73
73 -
 74
74 -
 75
75 -
76
-
77
-
78
-
79
-
80
-
81
-
82
-
83
-
84
-
85
-
86
-
87
-
88
-
89
-
90
-
91
-
92
-
93
-
94
-
95
-
96
-
97
-
98
-
99
-
100
-
101
-
102
-
103
-
104
-
105
-
106
-
107
-
108
-
109
-
110
-
111
-
112
-
113
-
114
-
115
-
116
-
117
-
118
-
119
-
120
-
121
-
122
-
123
-
124
-
125
-
126
-
127
-
128
-
129
-
130
-
131
-
132
-
133
-
134
-
135
-
136
-
137
-
138
-
139
-
140
-
141
-
142
-
143
-
144
-
145
-
146
-
147
-
148
-
149
-
150
-
151
-
152
-
153
-
154
-
155
-
156
-
157
-
158
-
159
-
160
-
161
-
162
-
163
-
164
-
165
-
166
-
167
-
168
-
169
-
170
-
171
-
172
 |
 |

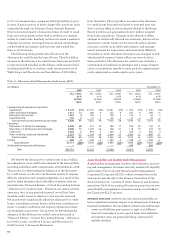
WELLS FARGO FINANCIAL Wells Fargo Financial originates real
estate secured debt consolidation loans, and both prime and
non-prime auto secured loans, unsecured loans and credit cards.
Wells Fargo Financial had $29.1 billion in real estate
secured loans as of December 31, 2008. Of this portfolio,
$1.8 billion is considered prime based on secondary market
standards and has been priced to the customer accordingly.
The remaining portfolio is non-prime but has been originated
with standards that effectively mitigate credit risk. It has
been originated through our retail channel with documented
income, LTV limits based on credit quality and property
characteristics, and risk-based pricing. In addition, the loans
were originated without teaser rates, interest-only or negative
amortization features. Credit losses in the portfolio have
increased in the current economic environment compared
with historical levels, but performance remained similar to
prime portfolios in the industry with overall credit losses
in 2008 of 1.08% on the entire portfolio. Of the portfolio,
$9.7 billion was originated with customer FICO scores below
620, but these loans have further restrictions on LTV and
debt-to-income ratios to limit the credit risk.
Wells Fargo Financial also had $23.6 billion in auto
secured loans and leases as of December 31, 2008, of which
$6.3 billion was originated with customer FICO scores below
620. Net charge-offs in this portfolio for 2008 were 4.05% for
FICO scores of 620 and above, and 6.27% for FICO scores
below 620. These loans were priced based on relative risk. Of
this portfolio, $18.2 billion represented loans and leases origi-
nated through its indirect auto business, which Wells Fargo
Financial ceased originating near the end of 2008.
Wells Fargo Financial had $8.4 billion in unsecured loans
and credit card receivables as of December 31, 2008, of which
$1.3 billion was originated with customer FICO scores below
620. Net charge offs in this portfolio for 2008 were 9.22% for
FICO scores of 620 and above, and 12.82% for FICO scores
below 620. These receivables were priced based on relative
risk. Wells Fargo Financial has been actively tightening cred-
it policies and managing credit lines to reduce exposure
given current economic conditions.
COMMERCIAL AND COMMERCIAL REAL ESTATE For purposes of
portfolio risk management, we aggregate commercial loans
and lease financing according to market segmentation and
standard industry codes. Commercial loans and lease financ-
ing are presented by industry in Table 17. These groupings
contain a highly diverse mix of customer relationships
throughout our target markets. Loan types and product
offerings are carefully underwritten and monitored. Credit
policies incorporate specific industry risks.
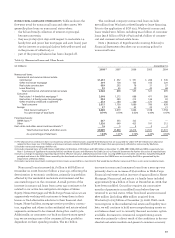
Table 17: Commercial Loans and Lease Financing by Industry
(in millions) December 31, 2008
Commercial % of
loans and lease total
financing loans
SOP 03-3 loans:
Real estate investment trust $ 704 *%
Investors 436 *
Media 428 *
Residential construction 360 *
Leisure 294 *
Other (1) 2,358 *
Total SOP 03-3 loans 4,580 1
All other loans:
Financial institutions 12,275 1
Oil and gas 11,828 1
Cyclical retailers 11,433 1
Utilities 10,821 1
Industrial equipment 9,566 1
Food and beverage 9,483 1
Healthcare 9,137 1
Business services 8,614 1
Public administration 7,176 1
Hotel/restaurant 6,339 1
Other (1) 117,046 14
Total all other loans 213,718 24
Total $218,298 25%
* Less than 1%.
(1) No other single category had loans in excess of $170 million and $6,329 million
for SOP 03-3 and all other loans, respectively.