Wells Fargo 2008 Annual Report Download - page 63
Download and view the complete annual report
Please find page 63 of the 2008 Wells Fargo annual report below. You can navigate through the pages in the report by either clicking on the pages listed below, or by using the keyword search tool below to find specific information within the annual report.-
 1
1 -
2
-
3
-
4
-
5
-
6
-
7
-
8
-
9
-
10
-
11
-
12
-
13
-
14
-
15
-
16
-
17
-
18
-
19
-
20
-
21
-
22
-
23
-
24
-
25
-
26
-
27
-
28
-
29
-
30
-
31
-
32
-
33
-
34
-
35
-
36
-
37
-
38
-
39
-
40
-
41
-
42
-
43
-
44
-
45
-
46
-
47
-
48
-
49
-
50
-
51
-
52
-
 53
53 -
 54
54 -
 55
55 -
 56
56 -
 57
57 -
 58
58 -
 59
59 -
 60
60 -
 61
61 -
 62
62 -
 63
63 -
 64
64 -
 65
65 -
 66
66 -
 67
67 -
 68
68 -
 69
69 -
 70
70 -
 71
71 -
 72
72 -
 73
73 -
74
-
75
-
76
-
77
-
78
-
79
-
80
-
81
-
82
-
83
-
84
-
85
-
86
-
87
-
88
-
89
-
90
-
91
-
92
-
93
-
94
-
95
-
96
-
97
-
98
-
99
-
100
-
101
-
102
-
103
-
104
-
105
-
106
-
107
-
108
-
109
-
110
-
111
-
112
-
113
-
114
-
115
-
116
-
117
-
118
-
119
-
120
-
121
-
122
-
123
-
124
-
125
-
126
-
127
-
128
-
129
-
130
-
131
-
132
-
133
-
134
-
135
-
136
-
137
-
138
-
139
-
140
-
141
-
142
-
143
-
144
-
145
-
146
-
147
-
148
-
149
-
150
-
151
-
152
-
153
-
154
-
155
-
156
-
157
-
158
-
159
-
160
-
161
-
162
-
163
-
164
-
165
-
166
-
167
-
168
-
169
-
170
-
171
-
172
 |
 |
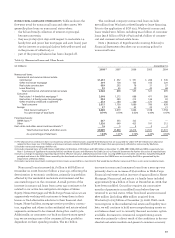
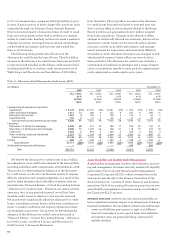
The deterioration in specific segments of the Home Equity
portfolios required a targeted approach to managing these
assets. A liquidating portfolio, consisting of home equity
loans generated through the wholesale channel not behind a
Wells Fargo first mortgage, and home equity loans acquired
through correspondents, was identified. While the $10.3 billion
of loans in this liquidating portfolio represented about 1% of
total loans outstanding at December 31, 2008, these loans
represented some of the highest risk in the $129.5 billion
Home Equity portfolios, with a loss rate of 6.18% compared
with 1.70% for the core portfolio. The loans in the liquidating
portfolio are largely concentrated in geographic markets that
have experienced the most abrupt and steepest declines
in housing prices. The core portfolio was $118.4 billion at
December 31, 2008, of which 98% was originated through
the retail channel and approximately 15% of the outstanding
balance was in a first lien position. Table 15 includes the
credit attributes of these two portfolios.
PICK-A-PAY PORTFOLIO Our Pick-a-Pay loan portfolio, which
we acquired in the Wachovia merger, had an outstanding bal-
ance of $119.6 billion and a carrying value of $95.3 billion at
December 31, 2008. The carrying value is net of $22.2 billion
of purchase accounting net write-downs to reflect SOP 03-3
loans at fair value and a $249 million increase to reflect all
other loans at a market rate of interest. Pick-a-Pay loans are
home mortgages on which the customer has the option each
month to select from among four payment options: (1) a
minimum payment as described below, (2) an interest-only
payment, (3) a fully amortizing 15-year payment, or (4) a fully
amortizing 30-year payment. Approximately 80% of the Pick-
a-Pay portfolio has payment options calculated using a monthly
adjustable interest rate; the rest of the portfolio is fixed rate.
Approximately 85% of the December 31, 2008, Pick-a-Pay
loan portfolio was originated under Wachovia’s “Quick Qualifier”
program where the level of documentation obtained from a
prospective customer relative to income and assets was
determined based in part on data provided by the customer
in their loan application. The remaining 15% was originated
with full documentation (verified assets and verified income).
The minimum monthly payment for substantially all of
our Pick-a-Pay loans is reset annually. The new minimum
monthly payment amount generally cannot exceed the prior
year’s minimum payment amount by more than 7.5%. The
minimum payment may not be sufficient to pay the monthly
interest due, and in those situations a loan on which the cus-
tomer has made a minimum payment is subject to “negative
amortization,” where unpaid interest is added to the principal
balance of the loan. The amount of interest that has been
added to a loan balance is referred to as “deferred interest.”
Our Pick-a-Pay customers have been fairly constant in their
utilization of the minimum payment option. Of our Pick-a-
Pay customers, approximately 66% at December 31, 2008,
based on number of loans, had elected this option. At
December 31, 2008, approximately 51% of Pick-a-Pay cus-
tomers had elected the minimum payment option in each
of the past six months.
Deferral of interest on a Pick-a-Pay loan may continue as
long as the loan balance remains below a pre-defined princi-
pal cap, which is based on the percentage that the current
loan balance represents to the original loan balance. Loans
with an original loan-to-value (LTV) ratio equal to or below
85% have a cap of 125% of the original loan balance, and these
loans represent substantially all of the Pick-a-Pay portfolio.
Loans with an original LTV ratio above 85% have a cap of
110% of the original loan balance. Pick-a-Pay loans on which
there is a deferred interest balance re-amortize (the monthly
payment amount is reset or “recast”) on the earlier of the
date when the loan balance reaches its principal cap, or the
10-year anniversary of the loan. After a recast, the customers’
new payment terms are reset to the amount necessary to
repay the balance over the remainder of the original loan
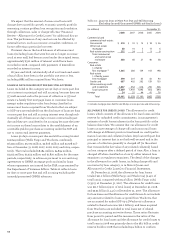
term. Based on assumptions of a flat rate environment, if all
eligible customers elect the minimum payment option 100%
of the time and no balances prepay, we would expect the
following balance of loans to recast based on reaching the cap:
$5 million in 2009, $15 million in 2010, $16 million in 2011 and
$45 million in 2012. In addition, we would expect the following
balance of ARM loans having a payment change based on the
contractual terms of the loan to recast; $27 million in 2009,
$59 million in 2010, $92 million in 2011 and $163 million in
2012.
Included in the Pick-a-Pay portfolio are loans accounted
for under SOP 03-3 with a total outstanding balance of
$61.9 billion and a carrying value of $37.6 billion. Loans that
we acquired from Wachovia with evidence of credit quality
deterioration since origination and for which it was probable
at the date of the Wachovia acquisition that we will be unable
to collect all contractually required payments are accounted
for under SOP 03-3, which requires that acquired credit-
impaired loans be recorded at fair value and prohibits carry-
ing over of the related allowance in the initial accounting.
In stressed housing markets with declining home prices
and increasing delinquencies, the LTV ratio is a key metric
in predicting future loan performance, including charge-offs.
Because SOP 03-3 loans are carried at fair value, the LTV ratio
is not necessarily a predictor of future loan performance. For
informational purposes we have also included the ratio of the
carrying amount to the current value of the loans.
To maximize return and allow flexibility for customers
to avoid foreclosure, we have in place several loss mitigation
strategies for our Pick-a-Pay loan portfolio. We contact
customers who are experiencing difficulty and may in certain
cases modify the terms of a loan based on a customer’s
documented income and other circumstances.