Wells Fargo 2008 Annual Report Download - page 53
Download and view the complete annual report
Please find page 53 of the 2008 Wells Fargo annual report below. You can navigate through the pages in the report by either clicking on the pages listed below, or by using the keyword search tool below to find specific information within the annual report.
the value of derivatives (economic hedges) used to hedge the
MSRs. Net servicing income for 2008 included a $242 million
net MSRs valuation loss that was recorded to earnings
($3.34 billion fair value loss offsetting by a $3.10 billion eco-
nomic hedging gain) and for 2007 included a $583 million net
MSRs valuation gain ($571 million fair value loss offsetting a
$1.15 billion economic hedging gain). Our portfolio of loans
serviced for others was $1.86 trillion, including $379 billion
acquired from Wachovia, at December 31, 2008, up 30% from
$1.43 trillion at December 31, 2007. At December 31, 2008, the
ratio of MSRs to related loans serviced for others was 0.87%.
Net gains on mortgage loan origination/sales activities
were $1,183 million in 2008, down from $1,289 million in 2007.
Residential real estate originations totaled $230 billion in
2008, compared with $272 billion in 2007. For additional
detail, see “Asset/Liability and Market Risk Management –
Mortgage Banking Interest Rate and Market Risk,” and Note 1
(Summary of Significant Accounting Policies), Note 9
(Mortgage Banking Activities) and Note 17 (Fair Values of
Assets and Liabilities) to Financial Statements.
Mortgage loans are repurchased based on standard repre-
sentations and warranties and early payment default clauses
in mortgage sale contracts. The $234 million increase in the
repurchase reserve in 2008 included $208 million related to
standard representations and warranties as the housing mar-
ket deteriorated and loss severities on repurchases increased.
An additional $26 million related to an increase in projected
early payment defaults, due to the overall deterioration in the
market. To the extent the market does not recover, Home
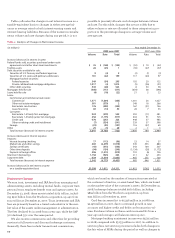
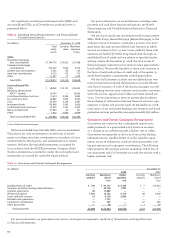
Table 5: Noninterest Income
(in millions) Year ended December 31, % Change
2008 2007 2006 2008/ 2007/
2007 2006
Service charges on
deposit accounts $ 3,190 $ 3,050 $ 2,690
5% 13%
Trust and investment fees:
Trust, investment and IRA fees 2,161 2,305 2,033
(6) 13
Commissions and all other fees
763 844 704 (10) 20
Total trust and
investment fees
2,924 3,149 2,737 (7) 15
Card fees
2,336 2,136 1,747 922
Other fees:
Cash network fees
188 193 184 (3) 5
Charges and fees on loans
1,037 1,011 976 34
All other fees
872 1,088 897 (20) 21
Total other fees
2,097 2,292 2,057 (9) 11
Mortgage banking:
Servicing income, net
979 1,511 893 (35) 69
Net gains on mortgage loan
origination/sales activities
1,183 1,289 1,116 (8) 16
All other
363 333 302 910
Total mortgage banking
2,525 3,133 2,311 (19) 36
Operating leases
427 703 783 (39) (10)
Insurance
1,830 1,530 1,340 20 14
Net gains from trading activities
275 544 544 (49) —
Net gains (losses) on debt
securities available for sale
1,037 209 (19) 396 NM
Net gains (losses) from
equity investments
(737) 734 738 NM (1)
All other
850 936 812 (9) 15
Total
$16,754 $18,416 $15,740 (9) 17
NM – Not meaningful
Mortgage could continue to have increased loss severity
on repurchases, causing future increases in the repurchase
reserve. In addition, there was $29 million in warehouse valua-
tion adjustments in 2008 due to increasing losses associated
with repurchase risk. The write-down of the mortgage ware-
house/pipeline in 2008 was $584 million, including losses of
$320 million due to spread widening primarily on the prime
mortgage warehouse caused by changes in liquidity. The
remaining $264 million of losses were primarily losses on unsal-
able loans. Due to the deterioration in the overall credit market
and related secondary market liquidity challenges, these losses
have been significant. Similar losses on unsalable loans could be
possible in the future if the housing market does not recover.
The 1-4 family first mortgage unclosed pipeline was $71 bil-
lion (including $5 billion from Wachovia) at December 31, 2008,
and $43 billion at December 31, 2007.
Operating lease income decreased 39% from a year ago, due
to continued softening in the auto market, reflecting tightened
credit standards. In third quarter 2008, we stopped originating
new indirect auto leases, but will continue to service existing
lease contracts.
Insurance revenue was up 20% from 2007, due to customer
growth, higher crop insurance revenue and the fourth quarter
2007 acquisition of ABD Insurance.
Income from trading activities was $275 million in 2008 and
$544 million in 2007. Income from trading activities and “all
other” income collectively included a $106 million charge in
2008 related to unsecured counterparty exposure on derivative
contracts with Lehman Brothers. Net investment gains (debt
and equity) totaled $300 million for 2008 and included other-
than-temporary impairment charges of $646 million for Fannie
Mae, Freddie Mac and Lehman Brothers, an additional $1,364
million of other-than-temporary write-downs and $1,710 million
of net realized investment gains. Net gains on debt securities
available for sale were $1,037 million for 2008 and $209 million
for 2007. Net gains (losses) from equity investments were
$(737) million in 2008, compared with $734 million in 2007. For
additional detail, see “Balance Sheet Analysis – Securities
Available for Sale” in this Report.
Noninterest Expense
We continued to build our business with investments in addi-
tional team members, largely sales and service professionals,
and new banking stores in 2008. Noninterest expense in 2008
decreased 1% from the prior year. In 2008, we opened 58 regional
banking stores and converted 32 stores acquired from Greater
Bay Bancorp, Farmers State Bank and United Bancorporation of
Wyoming, Inc. to our network. Noninterest expense for 2008
included $124 million of merger integration and severance costs.
Operating lease expense decreased 31% to $389 million in
2008 from $561 million in 2007, as we stopped originating new
indirect auto leases in third quarter 2008.
Insurance expense increased to $725 million in 2008 from
$416 million in 2007 due to the fourth quarter 2007 acquisition
of ABD Insurance, additional insurance reserves at our captive
mortgage reinsurance operation as well as higher commissions
on increased sales volume.


