Wells Fargo 2008 Annual Report Download - page 137
Download and view the complete annual report
Please find page 137 of the 2008 Wells Fargo annual report below. You can navigate through the pages in the report by either clicking on the pages listed below, or by using the keyword search tool below to find specific information within the annual report.-
 1
1 -
2
-
3
-
4
-
5
-
6
-
7
-
8
-
9
-
10
-
11
-
12
-
13
-
14
-
15
-
16
-
17
-
18
-
19
-
20
-
21
-
22
-
23
-
24
-
25
-
26
-
27
-
28
-
29
-
30
-
31
-
32
-
33
-
34
-
35
-
36
-
37
-
38
-
39
-
40
-
41
-
42
-
43
-
44
-
45
-
46
-
47
-
48
-
49
-
50
-
51
-
52
-
53
-
54
-
55
-
56
-
57
-
58
-
59
-
60
-
61
-
62
-
63
-
64
-
65
-
66
-
67
-
68
-
69
-
70
-
71
-
72
-
73
-
74
-
75
-
76
-
77
-
78
-
79
-
80
-
81
-
82
-
83
-
84
-
85
-
86
-
87
-
88
-
89
-
90
-
91
-
92
-
93
-
94
-
95
-
96
-
97
-
98
-
99
-
100
-
101
-
102
-
103
-
104
-
105
-
106
-
107
-
108
-
109
-
110
-
111
-
112
-
113
-
114
-
115
-
116
-
117
-
118
-
119
-
120
-
121
-
122
-
123
-
124
-
125
-
126
-
 127
127 -
 128
128 -
 129
129 -
 130
130 -
 131
131 -
 132
132 -
 133
133 -
 134
134 -
 135
135 -
 136
136 -
 137
137 -
 138
138 -
 139
139 -
 140
140 -
 141
141 -
 142
142 -
 143
143 -
 144
144 -
 145
145 -
 146
146 -
 147
147 -
148
-
149
-
150
-
151
-
152
-
153
-
154
-
155
-
156
-
157
-
158
-
159
-
160
-
161
-
162
-
163
-
164
-
165
-
166
-
167
-
168
-
169
-
170
-
171
-
172
 |
 |

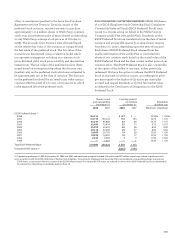
The higher payment risk category is based on the portion
of the maximum loss exposure for which there is a greater
risk that we will be required to make a payment or perform
under the credit derivative. The current status of the risk of
payment or performance being required is considered high
if the underlying assets under the credit derivative have an
external rating that is below investment grade or an internal
credit default grade that would be equivalent to a below
investment grade external rating. It is important to note that
the higher payment risk represents the amount of exposure
for which payment is of a high likelihood. Such payment may
not result in a loss. As such, the higher payment risk column
is not an indication of loss probability.
Counterparty Credit Risk
By using derivatives, we are exposed to credit risk if
counterparties to the derivative contracts do not perform as
expected. If a counterparty fails to perform, our counterparty
credit risk is equal to the amount reported as a derivative
asset in our balance sheet. The amounts reported as a
derivative asset are derivative contracts in a gain position,
and to the extent subject to master netting arrangements,
net of derivatives in a loss position with the same counterparty
and cash collateral received. We minimize counterparty
credit risk through credit approvals, limits, monitoring
procedures, executing master netting arrangements and
obtaining collateral, where appropriate. To the extent the
master netting arrangements and other criteria meet the
requirements of FASB Interpretation No. 39, Offsetting of
Amounts Related to Certain Contracts, as amended by FSP
FIN 39-1, derivatives balances and related cash collateral
amounts are shown net in the balance sheet. Counterparty
credit risk related to derivatives is considered and, if material,
provided for separately.
In connection with the bankruptcy filing by Lehman
Brothers in September 2008, we recognized a $106 million
charge in noninterest income related to unsecured counterparty
exposure on our derivative contracts with Lehman Brothers.
The bankruptcy filing triggered an early termination of the
derivative contracts that after consideration of the master
netting arrangement and posted cash collateral, resulted in
a net amount due to us of $106 million. We assessed the
collectability of this receivable and determined it was not
realizable. We took appropriate actions to replace, as necessary,
the terminated derivative contracts in order to maintain our
various risk management strategies that previously involved
the Lehman Brothers derivative contracts.
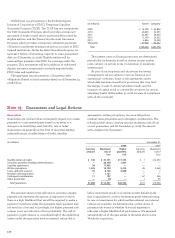
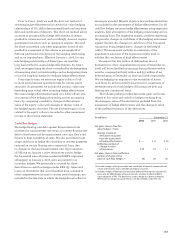
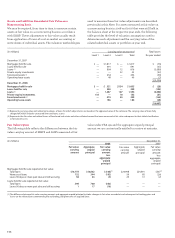
(in millions) December 31, 2008
Fair value Maximum Higher Range of
liability exposure payment maturities
risk
Credit default swaps on corporate bonds $ 9,643 $ 83,446 $39,987 2009-2018
Credit default swaps on structured products 4,940 7,451 5,824 2009-2056
Credit protection on credit default swap index 2,611 35,943 6,364 2009-2017
Credit protection on commercial mortgage-backed securities index 2,231 7,291 2,938 2009-2052
Credit protection on asset-backed securities index 1,331 1,526 1,116 2037-2046
Loan deliverable credit default swaps 106 611 592 2009-2014
Other 18 845 150 2009-2020
Total credit derivatives $20,880 $137,113 $56,971
The following table provides details of credit derivatives at December 31, 2008.