Wells Fargo 2008 Annual Report Download - page 55
Download and view the complete annual report
Please find page 55 of the 2008 Wells Fargo annual report below. You can navigate through the pages in the report by either clicking on the pages listed below, or by using the keyword search tool below to find specific information within the annual report.-
 1
1 -
2
-
3
-
4
-
5
-
6
-
7
-
8
-
9
-
10
-
11
-
12
-
13
-
14
-
15
-
16
-
17
-
18
-
19
-
20
-
21
-
22
-
23
-
24
-
25
-
26
-
27
-
28
-
29
-
30
-
31
-
32
-
33
-
34
-
35
-
36
-
37
-
38
-
39
-
40
-
41
-
42
-
43
-
44
-
 45
45 -
 46
46 -
 47
47 -
 48
48 -
 49
49 -
 50
50 -
 51
51 -
 52
52 -
 53
53 -
 54
54 -
 55
55 -
 56
56 -
 57
57 -
 58
58 -
 59
59 -
 60
60 -
 61
61 -
 62
62 -
 63
63 -
 64
64 -
 65
65 -
66
-
67
-
68
-
69
-
70
-
71
-
72
-
73
-
74
-
75
-
76
-
77
-
78
-
79
-
80
-
81
-
82
-
83
-
84
-
85
-
86
-
87
-
88
-
89
-
90
-
91
-
92
-
93
-
94
-
95
-
96
-
97
-
98
-
99
-
100
-
101
-
102
-
103
-
104
-
105
-
106
-
107
-
108
-
109
-
110
-
111
-
112
-
113
-
114
-
115
-
116
-
117
-
118
-
119
-
120
-
121
-
122
-
123
-
124
-
125
-
126
-
127
-
128
-
129
-
130
-
131
-
132
-
133
-
134
-
135
-
136
-
137
-
138
-
139
-
140
-
141
-
142
-
143
-
144
-
145
-
146
-
147
-
148
-
149
-
150
-
151
-
152
-
153
-
154
-
155
-
156
-
157
-
158
-
159
-
160
-
161
-
162
-
163
-
164
-
165
-
166
-
167
-
168
-
169
-
170
-
171
-
172
 |
 |

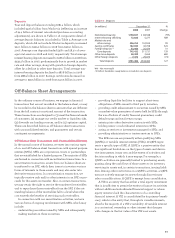
Balance Sheet Analysis
Securities Available for Sale
Our securities available for sale consist of both debt and
marketable equity securities. We hold debt securities available
for sale primarily for liquidity, interest rate risk management
and long-term yield enhancement. Accordingly, this portfolio
primarily includes liquid, high-quality federal agency debt
as well as privately issued mortgage-backed securities. At
December 31, 2008, we held $145.4 billion of debt securities
available for sale, including $63.7 billion acquired from Wachovia,
with net unrealized losses of $9.8 billion, compared with
$70.2 billion at December 31, 2007, with net unrealized gains
of $775 million. We also held $6.1 billion of marketable equity
securities available for sale at December 31, 2008, including
$3.7 billion acquired from Wachovia, and $2.8 billion at
December 31, 2007, with net unrealized losses of $160 million
and $95 million for the same periods, respectively. The net
unrealized loss in cumulative other comprehensive income at
December 31, 2008, related entirely to the legacy Wells Fargo
portfolio. The net unrealized loss related to the legacy
Wachovia portfolio was written off in purchase accounting.
The significant increase in net unrealized losses on debt
securities available for sale to $9.8 billion at December 31,
2008, from net unrealized gains of $775 million at December
31, 2007, was primarily due to extraordinarily wide asset
spreads for residential mortgage, commercial mortgage and
commercial loan asset-backed securities resulting from an
extremely illiquid market, causing these assets to be valued
at significant discounts from their cost. We conduct other-
than-temporary impairment analysis on a quarterly basis or
more often if a potential loss-triggering event occurs. We rec-
ognize an other-than-temporary impairment when it is proba-
ble that we will be unable to collect all amounts due accord-
ing to the contractual terms of the security and the fair value
of the investment security is less than its amortized cost. The
initial indication of other-than-temporary impairment for
both debt and equity securities is a decline in the market
value below the amount recorded for an investment, and the
severity and duration of the decline. In determining whether
an impairment is other than temporary, we consider the
length of time and the extent to which the market value has
been below cost, recent events specific to the issuer, includ-
ing investment downgrades by rating agencies and economic
conditions of its industry, and our ability and intent to hold
the investment for a period of time, including maturity, suffi-
cient to allow for any anticipated recovery in the fair value of
the security. For marketable equity securities, we also consider
the issuer’s financial condition, capital strength and near-term
prospects. For debt securities and for perpetual preferred
securities, which are treated as debt securities for the pur-
pose of other-than-temporary analysis, we also consider the
cause of the price decline (general level of interest rates and
industry- and issuer-specific factors), the issuer’s financial
condition, near-term prospects and current ability to make
future payments in a timely manner, the issuer’s ability to
service debt, any change in agencies’ ratings at evaluation
date from acquisition date and any likely imminent action,
and for asset-backed securities, the credit performance of the
underlying collateral, including delinquency rates, cumulative
losses to date, and the remaining credit enhancement com-
pared to expected credit losses of the security.
We have approximately $7 billion of investments in secu-
rities, primarily municipal bonds, that are guaranteed against
loss by bond insurers. These securities are almost exclusively
investment grade and were generally underwritten in accor-
dance with our own investment standards prior to the deter-
mination to purchase, without relying on the bond insurer’s
guarantee in making the investment decision. These securi-
ties will continue to be monitored as part of our on-going
impairment analysis of our securities available for sale, but
are expected to perform, even if the rating agencies reduce
the credit rating of the bond insurers.
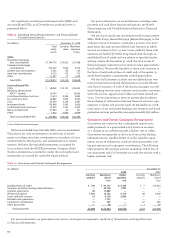
The weighted-average expected maturity of debt securi-
ties available for sale was 5.3 years at December 31, 2008.
Since 69% of this portfolio is mortgage-backed securities, the
expected remaining maturity may differ from contractual
maturity because borrowers generally have the right to pre-
pay obligations before the underlying mortgages mature. The
estimated effect of a 200 basis point increase or decrease in
interest rates on the fair value and the expected remaining
maturity of the mortgage-backed securities available for sale
is shown in Table 7.
See Note 5 (Securities Available for Sale) to Financial
Statements for securities available for sale by security type.
Table 7: Mortgage-Backed Securities
(in billions) Fair Net Remaining
value unrealized maturity
gain (loss)
At December 31, 2008 $ 99.7 $ (6.8) 2.9 yrs.
At December 31, 2008,
assuming a 200 basis point:
Increase in interest rates 90.9 (15.6) 4.3 yrs.
Decrease in interest rates 104.0 (2.5) 1.8 yrs.