Wells Fargo 2008 Annual Report Download - page 51
Download and view the complete annual report
Please find page 51 of the 2008 Wells Fargo annual report below. You can navigate through the pages in the report by either clicking on the pages listed below, or by using the keyword search tool below to find specific information within the annual report.-
 1
1 -
2
-
3
-
4
-
5
-
6
-
7
-
8
-
9
-
10
-
11
-
12
-
13
-
14
-
15
-
16
-
17
-
18
-
19
-
20
-
21
-
22
-
23
-
24
-
25
-
26
-
27
-
28
-
29
-
30
-
31
-
32
-
33
-
34
-
35
-
36
-
37
-
38
-
39
-
40
-
 41
41 -
 42
42 -
 43
43 -
 44
44 -
 45
45 -
 46
46 -
 47
47 -
 48
48 -
 49
49 -
 50
50 -
 51
51 -
 52
52 -
 53
53 -
 54
54 -
 55
55 -
 56
56 -
 57
57 -
 58
58 -
 59
59 -
 60
60 -
 61
61 -
62
-
63
-
64
-
65
-
66
-
67
-
68
-
69
-
70
-
71
-
72
-
73
-
74
-
75
-
76
-
77
-
78
-
79
-
80
-
81
-
82
-
83
-
84
-
85
-
86
-
87
-
88
-
89
-
90
-
91
-
92
-
93
-
94
-
95
-
96
-
97
-
98
-
99
-
100
-
101
-
102
-
103
-
104
-
105
-
106
-
107
-
108
-
109
-
110
-
111
-
112
-
113
-
114
-
115
-
116
-
117
-
118
-
119
-
120
-
121
-
122
-
123
-
124
-
125
-
126
-
127
-
128
-
129
-
130
-
131
-
132
-
133
-
134
-
135
-
136
-
137
-
138
-
139
-
140
-
141
-
142
-
143
-
144
-
145
-
146
-
147
-
148
-
149
-
150
-
151
-
152
-
153
-
154
-
155
-
156
-
157
-
158
-
159
-
160
-
161
-
162
-
163
-
164
-
165
-
166
-
167
-
168
-
169
-
170
-
171
-
172
 |
 |

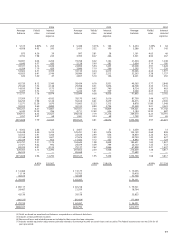
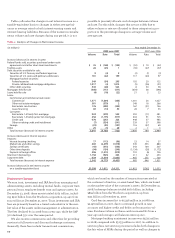
2006 2005 2004
Average Yields/ Interest Average Yields/ Interest Average Yields/ Interest
balance rates income/ balance rates income/ balance rates income/
expense expense expense
$ 5,515 4.80% $ 265 $ 5,448 3.01% $ 164 $ 4,254 1.49% $ 64
4,958 4.95 245 5,411 3.52 190 5,286 2.75 145
875 4.36 39 997 3.81 38 1,161 4.05 46
3,192 7.98 245 3,395 8.27 266 3,501 8.00 267
36,691 6.04 2,206 19,768 6.02 1,162 21,404 6.03 1,248
6,640 6.57 430 5,128 5.60 283 3,604 5.16 180
43,331 6.12 2,636 24,896 5.94 1,445 25,008 5.91 1,428
6,204 7.10 439 3,846 7.10 266 3,395 7.72 236
53,602 6.31 3,359 33,134 6.24 2,015 33,065 6.24 1,977
42,855 6.41 2,746 38,986 5.67 2,213 32,263 5.38 1,737
630 7.40 47 2,857 5.10 146 8,201 3.56 292
65,720 8.13 5,340 58,434 6.76 3,951 49,365 5.77 2,848
29,344 7.32 2,148 29,098 6.31 1,836 28,708 5.35 1,535
14,810 7.94 1,175 11,086 6.67 740 8,724 5.30 463
5,437 5.72 311 5,226 5.91 309 5,068 6.23 316
115,311 7.78 8,974 103,844 6.58 6,836 91,865 5.62 5,162
57,509 7.27 4,182 78,170 6.42 5,016 87,700 5.44 4,772
64,255 7.98 5,126 55,616 6.61 3,679 44,415 5.18 2,300
12,571 13.29 1,670 10,663 12.33 1,315 8,878 11.80 1,048
50,922 9.60 4,889 43,102 8.80 3,794 33,528 9.01 3,022
185,257 8.57 15,867 187,551 7.36 13,804 174,521 6.38 11,142
6,343 12.39 786 4,711 13.49 636 3,184 15.30 487
306,911 8.35 25,627 296,106 7.19 21,276 269,570 6.23 16,791
1,357 4.97 68 1,581 4.34 68 1,709 3.81 65
$415,828 7.79 32,357 $383,523 6.81 26,072 $354,348 5.97 21,071
$ 4,302 2.86 123 $ 3,607 1.43 51 $ 3,059 0.44 13
134,248 2.40 3,225 129,291 1.45 1,874 122,129 0.69 838
32,355 3.91 1,266 22,638 2.90 656 18,850 2.26 425
32,168 4.99 1,607 27,676 3.29 910 29,750 1.43 427
20,724 4.60 953 11,432 3.12 357 8,843 1.40 124
223,797 3.21 7,174 194,644 1.98 3,848 182,631 1.00 1,827
21,471 4.62 992 24,074 3.09 744 26,130 1.35 353
84,035 4.91 4,124 79,137 3.62 2,866 67,898 2.41 1,637
329,303 3.73 12,290 297,855 2.50 7,458 276,659 1.38 3,817
86,525 — — 85,668 — — 77,689 — —
$415,828 2.96 12,290 $383,523 1.95 7,458 $354,348 1.08 3,817
4.83% $20,067 4.86% $18,614 4.89% $17,254
$ 12,466 $ 13,173 $ 13,055
11,114 10,705 10,418
46,615 38,389 32,758
$ 70,195 $ 62,267 $ 56,231
$ 89,117 $ 87,218 $ 79,321
24,467 21,559 18,764
———
43,136 39,158 35,835
(86,525) (85,668) (77,689)
$ 70,195 $ 62,267 $ 56,231
$486,023 $445,790 $410,579
(4) Yields are based on amortized cost balances computed on a settlement date basis.
(5) Includes certain preferred securities.
(6) Nonaccrual loans and related income are included in their respective loan categories.
(7) Includes taxable-equivalent adjustments primarily related to tax-exempt income on certain loans and securities. The federal statutory tax rate was 35% for all
years presented.