Wells Fargo 2008 Annual Report Download - page 106
Download and view the complete annual report
Please find page 106 of the 2008 Wells Fargo annual report below. You can navigate through the pages in the report by either clicking on the pages listed below, or by using the keyword search tool below to find specific information within the annual report.-
 1
1 -
2
-
3
-
4
-
5
-
6
-
7
-
8
-
9
-
10
-
11
-
12
-
13
-
14
-
15
-
16
-
17
-
18
-
19
-
20
-
21
-
22
-
23
-
24
-
25
-
26
-
27
-
28
-
29
-
30
-
31
-
32
-
33
-
34
-
35
-
36
-
37
-
38
-
39
-
40
-
41
-
42
-
43
-
44
-
45
-
46
-
47
-
48
-
49
-
50
-
51
-
52
-
53
-
54
-
55
-
56
-
57
-
58
-
59
-
60
-
61
-
62
-
63
-
64
-
65
-
66
-
67
-
68
-
69
-
70
-
71
-
72
-
73
-
74
-
75
-
76
-
77
-
78
-
79
-
80
-
81
-
82
-
83
-
84
-
85
-
86
-
87
-
88
-
89
-
90
-
91
-
92
-
93
-
94
-
95
-
 96
96 -
 97
97 -
 98
98 -
 99
99 -
 100
100 -
 101
101 -
 102
102 -
 103
103 -
 104
104 -
 105
105 -
 106
106 -
 107
107 -
 108
108 -
 109
109 -
 110
110 -
 111
111 -
 112
112 -
 113
113 -
 114
114 -
 115
115 -
 116
116 -
117
-
118
-
119
-
120
-
121
-
122
-
123
-
124
-
125
-
126
-
127
-
128
-
129
-
130
-
131
-
132
-
133
-
134
-
135
-
136
-
137
-
138
-
139
-
140
-
141
-
142
-
143
-
144
-
145
-
146
-
147
-
148
-
149
-
150
-
151
-
152
-
153
-
154
-
155
-
156
-
157
-
158
-
159
-
160
-
161
-
162
-
163
-
164
-
165
-
166
-
167
-
168
-
169
-
170
-
171
-
172
 |
 |

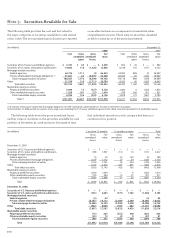
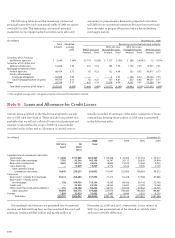
The following table shows the gross unrealized losses
and fair value of securities in the securities available-for-sale
portfolio at December 31, 2008 and 2007, by length of time
The following table provides the cost and fair value for
the major categories of securities available for sale carried
at fair value. The net unrealized gains (losses) are reported
Note 5: Securities Available for Sale
on an after-tax basis as a component of cumulative other
comprehensive income. There were no securities classified
as held to maturity as of the periods presented.
that individual securities in each category had been in a
continuous loss position.
(in millions) December 31,
2008 2007
Cost Gross Gross Fair Cost Gross Gross Fair
unrealized unrealized value unrealized unrealized value
gains losses gains losses
Securities of U.S. Treasury and federal agencies $ 3,187 $ 62 $ — $ 3,249 $ 962 $ 20 $ — $ 982
Securities of U.S. states and political subdivisions 14,062 116 (1,520) 12,658 6,128 135 (111) 6,152
Mortgage-backed securities:
Federal agencies 64,726 1,711 (3) 66,434 34,092 898 (3) 34,987
Private collateralized mortgage obligations (1) 41,841 62 (8,595) 33,308 20,026 82 (126) 19,982
Total mortgage-backed securities 106,567 1,773 (8,598) 99,742 54,118 980 (129) 54,969
Other 31,379 116 (1,711) 29,784 8,185 45 (165) 8,065
Total debt securities 155,195 2,067 (11,829) 145,433 69,393 1,180 (405) 70,168
Marketable equity securities:
Perpetual preferred securities 5,040 13 (327) 4,726 2,082 6 (236) 1,852
Other marketable equity securities 1,256 181 (27) 1,410 796 166 (31) 931
Total marketable equity securities 6,296 194 (354) 6,136 2,878 172 (267) 2,783
Total (2) $161,491 $2,261 $(12,183) $151,569 $72,271 $1,352 $(672) $72,951
(1) A majority of the private collateralized mortgage obligations are AAA-rated bonds collateralized by 1-4 family residential first mortgages.
(2) At December 31, 2008, we held no securities of any single issuer (excluding the U.S. Treasury and federal agencies) with a book value that exceeded 10% of stockholders’ equity.
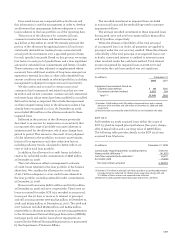
(in millions) Less than 12 months 12 months or more Total
Gross Fair Gross Fair Gross Fair
unrealized value unrealized value unrealized value
losses losses losses
December 31, 2007
Securities of U.S. Treasury and federal agencies $ — $ — $ — $ — $ — $ —
Securities of U.S. states and political subdivisions (98) 1,957 (13) 70 (111) 2,027
Mortgage-backed securities:
Federal agencies (1) 39 (2) 150 (3) 189
Private collateralized mortgage obligations (124) 7,722 (2) 54 (126) 7,776
Total mortgage-backed securities (125) 7,761 (4) 204 (129) 7,965
Other (140) 2,425 (25) 491 (165) 2,916
Total debt securities (363) 12,143 (42) 765 (405) 12,908
Marketable equity securities:
Perpetual preferred securities (236) 1,404 — 9 (236) 1,413
Other marketable equity securities (30) 284 (1) 27 (31) 311
Total marketable equity securities (266) 1,688 (1) 36 (267) 1,724
Total $ (629) $ 13,831 $ (43) $ 801 $ (672) $ 14,632
December 31, 2008
Securities of U.S. Treasury and federal agencies $ — $ — $ — $ — $ — $ —
Securities of U.S. states and political subdivisions (745) 3,483 (775) 1,702 (1,520) 5,185
Mortgage-backed securities:
Federal agencies (3) 83 — — (3) 83
Private collateralized mortgage obligations (6,197) 14,112 (2,398) 2,540 (8,595) 16,652
Total mortgage-backed securities (6,200) 14,195 (2,398) 2,540 (8,598) 16,735
Other (952) 9,909 (759) 687 (1,711) 10,596
Total debt securities (7,897) 27,587 (3,932) 4,929 (11,829) 32,516
Marketable equity securities:
Perpetual preferred securities (75) 265 (252) 360 (327) 625
Other marketable equity securities (23) 72 (4) 9 (27) 81
Total marketable equity securities (98) 337 (256) 369 (354) 706
Total $(7,995) $27,924 $(4,188) $5,298 $(12,183) $33,222