Wells Fargo 2008 Annual Report Download - page 145
Download and view the complete annual report
Please find page 145 of the 2008 Wells Fargo annual report below. You can navigate through the pages in the report by either clicking on the pages listed below, or by using the keyword search tool below to find specific information within the annual report.-
 1
1 -
2
-
3
-
4
-
5
-
6
-
7
-
8
-
9
-
10
-
11
-
12
-
13
-
14
-
15
-
16
-
17
-
18
-
19
-
20
-
21
-
22
-
23
-
24
-
25
-
26
-
27
-
28
-
29
-
30
-
31
-
32
-
33
-
34
-
35
-
36
-
37
-
38
-
39
-
40
-
41
-
42
-
43
-
44
-
45
-
46
-
47
-
48
-
49
-
50
-
51
-
52
-
53
-
54
-
55
-
56
-
57
-
58
-
59
-
60
-
61
-
62
-
63
-
64
-
65
-
66
-
67
-
68
-
69
-
70
-
71
-
72
-
73
-
74
-
75
-
76
-
77
-
78
-
79
-
80
-
81
-
82
-
83
-
84
-
85
-
86
-
87
-
88
-
89
-
90
-
91
-
92
-
93
-
94
-
95
-
96
-
97
-
98
-
99
-
100
-
101
-
102
-
103
-
104
-
105
-
106
-
107
-
108
-
109
-
110
-
111
-
112
-
113
-
114
-
115
-
116
-
117
-
118
-
119
-
120
-
121
-
122
-
123
-
124
-
125
-
126
-
127
-
128
-
129
-
130
-
131
-
132
-
133
-
134
-
 135
135 -
 136
136 -
 137
137 -
 138
138 -
 139
139 -
 140
140 -
 141
141 -
 142
142 -
 143
143 -
 144
144 -
 145
145 -
 146
146 -
 147
147 -
 148
148 -
 149
149 -
 150
150 -
 151
151 -
 152
152 -
 153
153 -
 154
154 -
 155
155 -
156
-
157
-
158
-
159
-
160
-
161
-
162
-
163
-
164
-
165
-
166
-
167
-
168
-
169
-
170
-
171
-
172
 |
 |

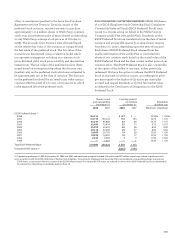
Interest income on MHFS measured at fair value is
calculated based on the note rate of the loan and is recorded
in interest income in the income statement.
For MHFS measured at fair value under FAS 159, the
estimated amount of losses included in earnings attributable to
instrument-specific credit risk for the year ended December 31,
2008 and 2007, was $648 million and $515 million, respectively.
For performing loans, instrument-specific credit risk gains
or losses were derived principally by determining the change
in fair value of the loans due to changes in the observable or
implied credit spread. Credit spread is the market yield on
the loans less the relevant risk-free benchmark interest rate.
Since the second half of 2007, spreads have been significantly
impacted by the lack of liquidity in the secondary market for
mortgage loans. For nonperforming loans, we attribute all
changes in fair value to instrument-specific credit risk.
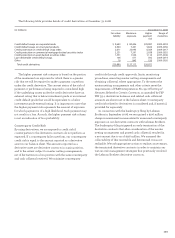
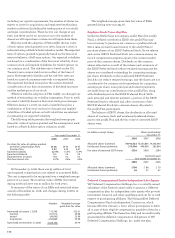
(in millions) December 31,
2008 2007
Carrying Estimated Carrying Estimated
amount fair value amount fair value
FINANCIAL ASSETS
Mortgages held for sale
(1)
$ 1,334 $ 1,333 $ 1,817 $ 1,817
Loans held for sale 5,830 5,876 948 955
Loans, net 843,817 829,603 376,888 377,219
Nonmarketable equity investments (cost method) 11,104 11,220 5,855 6,076
FINANCIAL LIABILITIES
Deposits $781,402 $781,964 $344,460 $344,484
Long-term debt
(2)
267,055 266,023 99,373 98,449
(1) Balance excludes mortgages held for sale for which the fair value option under FAS 159 was elected, and therefore includes nonprime residential and commercial
mortgages held for sale.
(2) The carrying amount and fair value exclude obligations under capital leases of $103 million and $20 million at December 31, 2008 and 2007, respectively.
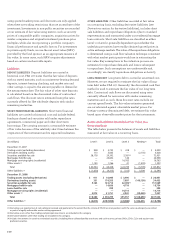
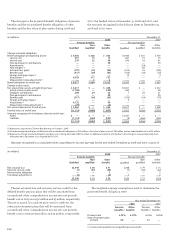
FAS 107, Disclosures about Fair Value of
Financial Instruments
The table below is a summary of fair value estimates as
of December 31, 2008 and 2007, for financial instruments,
as defined by FAS 107, excluding short-term financial assets
and liabilities, for which carrying amounts approximate fair
value, and excluding financial instruments recorded at fair
value on a recurring basis. The carrying amounts in the
following table are recorded in the balance sheet under the
indicated captions.
In accordance with FAS 107, we have not included assets
and liabilities that are not financial instruments in our
disclosure, such as the value of the long-term relationships
with our deposit, credit card and trust customers, amortized
MSRs, premises and equipment, goodwill and other intangibles,
deferred taxes and other liabilities. Additionally, the amounts
in the table have not been updated since year end, therefore
the valuations may have changed significantly since that
point in time. For these reasons, the total of the fair value
calculations presented does not represent, and should not be
construed to represent, the underlying value of the Company.
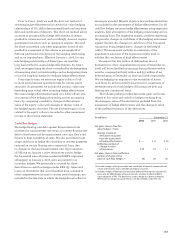
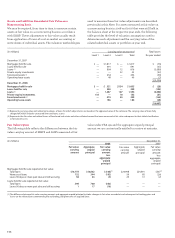
The assets accounted for under FAS 159 are initially
measured at fair value. Gains and losses from initial
measurement and subsequent changes in fair value are
recognized in earnings. The changes in fair values related
to initial measurement and subsequent changes in fair value
included in earnings for these assets measured at fair value
are shown, by income statement line item, below.
(in millions) Year ended December 31,
2008 2007
Mortgages Other Mortgages Other
held for interests held for interests
sale held sale held
Changes in fair value included in net income:
Mortgage banking noninterest income:
Net gains on mortgage loan origination/sales activities (1) $2,111 $ — $986 $ —
Other noninterest income — (109) — (153)
(1) Includes changes in fair value of servicing associated with MHFS.