Wells Fargo 2008 Annual Report Download - page 88
Download and view the complete annual report
Please find page 88 of the 2008 Wells Fargo annual report below. You can navigate through the pages in the report by either clicking on the pages listed below, or by using the keyword search tool below to find specific information within the annual report.-
 1
1 -
2
-
3
-
4
-
5
-
6
-
7
-
8
-
9
-
10
-
11
-
12
-
13
-
14
-
15
-
16
-
17
-
18
-
19
-
20
-
21
-
22
-
23
-
24
-
25
-
26
-
27
-
28
-
29
-
30
-
31
-
32
-
33
-
34
-
35
-
36
-
37
-
38
-
39
-
40
-
41
-
42
-
43
-
44
-
45
-
46
-
47
-
48
-
49
-
50
-
51
-
52
-
53
-
54
-
55
-
56
-
57
-
58
-
59
-
60
-
61
-
62
-
63
-
64
-
65
-
66
-
67
-
68
-
69
-
70
-
71
-
72
-
73
-
74
-
75
-
76
-
77
-
 78
78 -
 79
79 -
 80
80 -
 81
81 -
 82
82 -
 83
83 -
 84
84 -
 85
85 -
 86
86 -
 87
87 -
 88
88 -
 89
89 -
 90
90 -
 91
91 -
 92
92 -
 93
93 -
 94
94 -
 95
95 -
 96
96 -
 97
97 -
 98
98 -
99
-
100
-
101
-
102
-
103
-
104
-
105
-
106
-
107
-
108
-
109
-
110
-
111
-
112
-
113
-
114
-
115
-
116
-
117
-
118
-
119
-
120
-
121
-
122
-
123
-
124
-
125
-
126
-
127
-
128
-
129
-
130
-
131
-
132
-
133
-
134
-
135
-
136
-
137
-
138
-
139
-
140
-
141
-
142
-
143
-
144
-
145
-
146
-
147
-
148
-
149
-
150
-
151
-
152
-
153
-
154
-
155
-
156
-
157
-
158
-
159
-
160
-
161
-
162
-
163
-
164
-
165
-
166
-
167
-
168
-
169
-
170
-
171
-
172
 |
 |

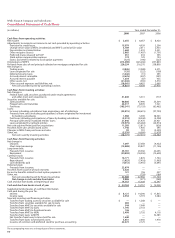
Wells Fargo & Company and Subsidiaries
Consolidated Statement of Income
(in millions, except per share amounts) Year ended December 31,
2008 2007 2006
INTEREST INCOME
Trading assets $ 177 $ 173 $ 225
Securities available for sale 5,287 3,451 3,278
Mortgages held for sale 1,573 2,150 2,746
Loans held for sale 48 70 47
Loans 27,632 29,040 25,611
Other interest income 181 293 332
Total interest income 34,898 35,177 32,239
INTEREST EXPENSE
Deposits 4,521 8,152 7,174
Short-term borrowings 1,478 1,245 992
Long-term debt 3,756 4,806 4,122
Total interest expense 9,755 14,203 12,288
NET INTEREST INCOME 25,143 20,974 19,951
Provision for credit losses 15,979 4,939 2,204
Net interest income after provision for credit losses 9,164 16,035 17,747
NONINTEREST INCOME
Service charges on deposit accounts 3,190 3,050 2,690
Trust and investment fees 2,924 3,149 2,737
Card fees 2,336 2,136 1,747
Other fees 2,097 2,292 2,057
Mortgage banking 2,525 3,133 2,311
Operating leases 427 703 783
Insurance 1,830 1,530 1,340
Net gains (losses) on debt securities available for sale 1,037 209 (19)
Net gains (losses) from equity investments (737) 734 738
Other 1,125 1,480 1,356
Total noninterest income 16,754 18,416 15,740
NONINTEREST EXPENSE
Salaries 8,260 7,762 7,007
Commission and incentive compensation 2,676 3,284 2,885
Employee benefits 2,004 2,322 2,035
Equipment 1,357 1,294 1,252
Net occupancy 1,619 1,545 1,405
Operating leases 389 561 630
Other 6,356 6,056 5,623
Total noninterest expense 22,661 22,824 20,837
INCOME BEFORE INCOME TAX EXPENSE 3,257 11,627 12,650
Income tax expense 602 3,570 4,230
NET INCOME $ 2,655 $ 8,057 $ 8,420
NET INCOME APPLICABLE TO COMMON STOCK $ 2,369 $ 8,057 $ 8,420
EARNINGS PER COMMON SHARE $0.70 $ 2.41 $ 2.50
DILUTED EARNINGS PER COMMON SHARE $ 0.70 $ 2.38 $ 2.47
DIVIDENDS DECLARED PER COMMON SHARE $ 1.30 $ 1.18 $ 1.08
Average common shares outstanding 3,378.1 3,348.5 3,368.3
Diluted average common shares outstanding 3,391.3 3,382.8 3,410.1
The accompanying notes are an integral part of these statements.
Financial Statements