Wells Fargo 2008 Annual Report Download - page 116
Download and view the complete annual report
Please find page 116 of the 2008 Wells Fargo annual report below. You can navigate through the pages in the report by either clicking on the pages listed below, or by using the keyword search tool below to find specific information within the annual report.-
 1
1 -
2
-
3
-
4
-
5
-
6
-
7
-
8
-
9
-
10
-
11
-
12
-
13
-
14
-
15
-
16
-
17
-
18
-
19
-
20
-
21
-
22
-
23
-
24
-
25
-
26
-
27
-
28
-
29
-
30
-
31
-
32
-
33
-
34
-
35
-
36
-
37
-
38
-
39
-
40
-
41
-
42
-
43
-
44
-
45
-
46
-
47
-
48
-
49
-
50
-
51
-
52
-
53
-
54
-
55
-
56
-
57
-
58
-
59
-
60
-
61
-
62
-
63
-
64
-
65
-
66
-
67
-
68
-
69
-
70
-
71
-
72
-
73
-
74
-
75
-
76
-
77
-
78
-
79
-
80
-
81
-
82
-
83
-
84
-
85
-
86
-
87
-
88
-
89
-
90
-
91
-
92
-
93
-
94
-
95
-
96
-
97
-
98
-
99
-
100
-
101
-
102
-
103
-
104
-
105
-
 106
106 -
 107
107 -
 108
108 -
 109
109 -
 110
110 -
 111
111 -
 112
112 -
 113
113 -
 114
114 -
 115
115 -
 116
116 -
 117
117 -
 118
118 -
 119
119 -
 120
120 -
 121
121 -
 122
122 -
 123
123 -
 124
124 -
 125
125 -
 126
126 -
127
-
128
-
129
-
130
-
131
-
132
-
133
-
134
-
135
-
136
-
137
-
138
-
139
-
140
-
141
-
142
-
143
-
144
-
145
-
146
-
147
-
148
-
149
-
150
-
151
-
152
-
153
-
154
-
155
-
156
-
157
-
158
-
159
-
160
-
161
-
162
-
163
-
164
-
165
-
166
-
167
-
168
-
169
-
170
-
171
-
172
 |
 |

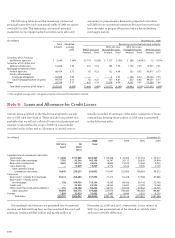
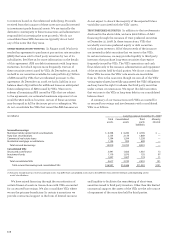
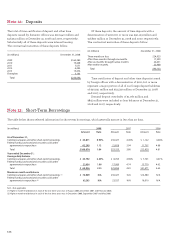
(in millions) December 31, Year ended December 31,
Total loans(1) Delinquent loans(2)(3) Net charge-offs (recoveries)(3)
2008 2007 2008 2007 2008 2007
Commercial and commercial real estate:
Commercial $ 204,113 $ 91,186 $ 1,471 $ 464 $1,539 $ 510
Other real estate mortgage 310,480 75,642 1,058 179 26 7
Real estate construction 34,676 18,854 1,221 317 175 12
Lease financing 15,829 6,772 92 45 52 16
Total commercial and commercial real estate 565,098 192,454 3,842 1,005 1,792 545
Consumer:
Real estate 1- 4 family first mortgage 1,165,456 146,997 7,531 1,745 902 87
Real estate 1- 4 family junior lien mortgage 115,308 75,974 1,554 495 2,115 597
Credit card 23,555 18,762 687 402 1,416 712
Other revolving credit and installment 104,886 56,521 1,427 744 1,819 1,409
Total consumer 1,409,205 298,254 11,199 3,386 6,252 2,805
Foreign 33,882 7,647 91 104 196 206
Total loans owned and securitized 2,008,185 498,355 $15,132 $4,495 $8,240 $3,556
Less:
Securitized loans 1,117,039 88,397
Mortgages held for sale 20,088 26,815
Loans held for sale 6,228 948
Total loans held $ 864,830 $382,195
(1) For 2008, represents loans in the balance sheet or that have been securitized and includes residential mortgages sold to FNMA and FHLMC and securitizations where
servicing is our only form of continuing involvement. For 2007, excluded loans securitized through FNMA and FHLMC and those we continued to service, but for which
we have no other continuing involvement.
(2) Delinquent loans are 90 days or more past due and still accruing interest as well as nonaccrual loans.
(3) Delinquent loans and net charge-offs exclude loans sold to FNMA and FHLMC. We continue to service the loans and would only experience a loss if required to repurchase
a delinquent loan due to a breach in original representations and warranties associated with our underwriting standards.
The table below presents information about the principal
balances of owned and securitized loans.