Wells Fargo 2008 Annual Report Download - page 108
Download and view the complete annual report
Please find page 108 of the 2008 Wells Fargo annual report below. You can navigate through the pages in the report by either clicking on the pages listed below, or by using the keyword search tool below to find specific information within the annual report.-
 1
1 -
2
-
3
-
4
-
5
-
6
-
7
-
8
-
9
-
10
-
11
-
12
-
13
-
14
-
15
-
16
-
17
-
18
-
19
-
20
-
21
-
22
-
23
-
24
-
25
-
26
-
27
-
28
-
29
-
30
-
31
-
32
-
33
-
34
-
35
-
36
-
37
-
38
-
39
-
40
-
41
-
42
-
43
-
44
-
45
-
46
-
47
-
48
-
49
-
50
-
51
-
52
-
53
-
54
-
55
-
56
-
57
-
58
-
59
-
60
-
61
-
62
-
63
-
64
-
65
-
66
-
67
-
68
-
69
-
70
-
71
-
72
-
73
-
74
-
75
-
76
-
77
-
78
-
79
-
80
-
81
-
82
-
83
-
84
-
85
-
86
-
87
-
88
-
89
-
90
-
91
-
92
-
93
-
94
-
95
-
96
-
97
-
 98
98 -
 99
99 -
 100
100 -
 101
101 -
 102
102 -
 103
103 -
 104
104 -
 105
105 -
 106
106 -
 107
107 -
 108
108 -
 109
109 -
 110
110 -
 111
111 -
 112
112 -
 113
113 -
 114
114 -
 115
115 -
 116
116 -
 117
117 -
 118
118 -
119
-
120
-
121
-
122
-
123
-
124
-
125
-
126
-
127
-
128
-
129
-
130
-
131
-
132
-
133
-
134
-
135
-
136
-
137
-
138
-
139
-
140
-
141
-
142
-
143
-
144
-
145
-
146
-
147
-
148
-
149
-
150
-
151
-
152
-
153
-
154
-
155
-
156
-
157
-
158
-
159
-
160
-
161
-
162
-
163
-
164
-
165
-
166
-
167
-
168
-
169
-
170
-
171
-
172
 |
 |

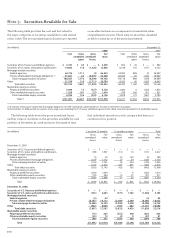
(in millions) December 31, 2008
Total Weighted- Remaining contractual principal maturity
amount average After one year After five years
yield Within one year through five years through ten years After ten years
Amount Yield Amount Yield Amount Yield Amount Yield
Securities of U.S. Treasury
and federal agencies $ 3,249 1.54% $1,719 0.02% $ 1,127 3.15% $ 388 3.40% $ 15 4.79%
Securities of U.S. states and
political subdivisions 12,658 7.54 210 5.54 784 7.36 1,163 7.39 10,501 7.61
Mortgage-backed securities:
Federal agencies 66,434 5.73 42 4.23 122 4.98 353 6.02 65,917 5.73
Private collateralized
mortgage obligations 33,308 7.04 —— 5 2.22 169 8.54 33,134 7.03
Total mortgage-backed securities 99,742 6.17 42 4.23 127 4.87 522 6.83 99,051 6.17
Other 29,784 5.27 475 5.34 11,874 6.59 4,367 5.97 13,068 3.85
Total debt securities at fair value (1) $145,433 6.00% $2,446 1.60% $13,912 6.34% $6,440 6.14% $122,635 6.04%
(1) The weighted-average yield is computed using the contractual life amortization method.
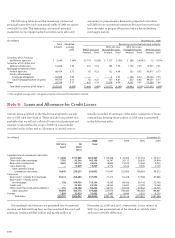
The following table shows the remaining contractual
principal maturities and contractual yields of debt securities
available for sale. The remaining contractual principal
maturities for mortgage-backed securities were allocated
assuming no prepayments. Remaining expected maturities
will differ from contractual maturities because borrowers may
have the right to prepay obligations before the underlying
mortgages mature.
Certain loans acquired in the Wachovia acquisition are sub-
ject to SOP 03-3 (see Note 1). These include loans where it is
probable that we will not collect all contractual principal and
interest. Loans within the scope of SOP 03-3 are initially
recorded at fair value, and no allowance is carried over or
Note 6: Loans and Allowance for Credit Losses
(in millions) December 31,
2008 2007 2006 2005 2004
SOP 03-3 All Total
loans other
loans
Commercial and commercial real estate:
Commercial $ 4,580 $197,889 $202,469 $ 90,468 $ 70,404 $ 61,552 $ 54,517
Other real estate mortgage 7,762 95,346 103,108 36,747 30,112 28,545 29,804
Real estate construction 4,503 30,173 34,676 18,854 15,935 13,406 9,025
Lease financing — 15,829 15,829 6,772 5,614 5,400 5,169
Total commercial and
commercial real estate 16,845 339,237 356,082 152,841 122,065 108,903 98,515
Consumer:
Real estate 1-4 family first mortgage 39,214 208,680 247,894 71,415 53,228 77,768 87,686
Real estate 1-4 family junior
lien mortgage 728 109,436 110,164 75,565 68,926 59,143 52,190
Credit card — 23,555 23,555 18,762 14,697 12,009 10,260
Other revolving credit and installment 151 93,102 93,253 56,171 53,534 47,462 34,725
Total consumer 40,093 434,773 474,866 221,913 190,385 196,382 184,861
Foreign 1,859 32,023 33,882 7,441 6,666 5,552 4,210
Total loans $58,797 $806,033 $864,830 $382,195 $319,116 $310,837 $287,586
Outstanding loan balances are presented net of unearned
income, net deferred loan fees, and unamortized discount and
premium totaling $16,891 million and $4,083 million at
December 31, 2008 and 2007, respectively. Loans subject to
SOP 03-3 are presented net of the related accretable yield
and nonaccretable difference.
initially recorded. A summary of the major categories of loans
outstanding showing those subject to SOP 03-3 is presented
in the following table.