Wells Fargo 2008 Annual Report Download - page 70
Download and view the complete annual report
Please find page 70 of the 2008 Wells Fargo annual report below. You can navigate through the pages in the report by either clicking on the pages listed below, or by using the keyword search tool below to find specific information within the annual report.-
 1
1 -
2
-
3
-
4
-
5
-
6
-
7
-
8
-
9
-
10
-
11
-
12
-
13
-
14
-
15
-
16
-
17
-
18
-
19
-
20
-
21
-
22
-
23
-
24
-
25
-
26
-
27
-
28
-
29
-
30
-
31
-
32
-
33
-
34
-
35
-
36
-
37
-
38
-
39
-
40
-
41
-
42
-
43
-
44
-
45
-
46
-
47
-
48
-
49
-
50
-
51
-
52
-
53
-
54
-
55
-
56
-
57
-
58
-
59
-
 60
60 -
 61
61 -
 62
62 -
 63
63 -
 64
64 -
 65
65 -
 66
66 -
 67
67 -
 68
68 -
 69
69 -
 70
70 -
 71
71 -
 72
72 -
 73
73 -
 74
74 -
 75
75 -
 76
76 -
 77
77 -
 78
78 -
 79
79 -
 80
80 -
81
-
82
-
83
-
84
-
85
-
86
-
87
-
88
-
89
-
90
-
91
-
92
-
93
-
94
-
95
-
96
-
97
-
98
-
99
-
100
-
101
-
102
-
103
-
104
-
105
-
106
-
107
-
108
-
109
-
110
-
111
-
112
-
113
-
114
-
115
-
116
-
117
-
118
-
119
-
120
-
121
-
122
-
123
-
124
-
125
-
126
-
127
-
128
-
129
-
130
-
131
-
132
-
133
-
134
-
135
-
136
-
137
-
138
-
139
-
140
-
141
-
142
-
143
-
144
-
145
-
146
-
147
-
148
-
149
-
150
-
151
-
152
-
153
-
154
-
155
-
156
-
157
-
158
-
159
-
160
-
161
-
162
-
163
-
164
-
165
-
166
-
167
-
168
-
169
-
170
-
171
-
172
 |
 |

(1.07% of average loans), compared with $536 million (0.40%)
in 2007. A major portion of these charge-offs came from loans
originated through our Business Direct channel. Business
Direct consists primarily of unsecured lines of credit to small
firms and sole proprietors that tend to perform in a manner
similar to credit cards. Similarly, we have not made a market in
subprime securities. Leveraged-buyout-related outstandings
are diversified by business and borrower and totaled less
than 4% of total loans.
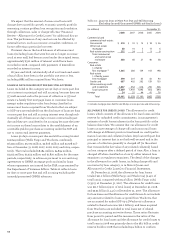
The following table presents the allocation of the
allowance for credit losses by type of loans. The $16.2 billion
increase in the allowance for credit losses from year-end 2007
to year-end 2008 included an $8.1 billion credit reserve build,
including $3.9 billion to conform credit reserve practices of
Wells Fargo and Wachovia, and the addition of $7.8 billion
from Wachovia. The $1.55 billion increase in the allowance
for credit losses from year-end 2006 to year-end 2007 was
due to actions taken in 2007 primarily related to the Home
Equity portfolio and approximately $100 million acquired
from bank acquisitions. Changes in the allowance reflect
changes in statistically derived loss estimates, historical loss
experience, current trends in borrower risk and/or general
economic activity on portfolio performance, and manage-
ment’s estimate for imprecision and uncertainty. Effective
December 31, 2006, the entire allowance was assigned to indi-
vidual portfolio types to better reflect our view of risk in
these portfolios. The allowance for credit losses includes a
combination of baseline loss estimates and a range of impre-
cision or uncertainty specific to each portfolio segment previ-
ously categorized as unallocated in prior years.
We believe the allowance for credit losses of $21.7 billion
was adequate to cover credit losses inherent in the loan portfolio,
including unfunded credit commitments, at December 31, 2008.
The process for determining the adequacy of the allowance
for credit losses is critical to our financial results. It requires
difficult, subjective and complex judgments as a result of the
need to make estimates about the effect of matters that are
uncertain. See “Financial Review – Critical Accounting Policies
– Allowance for Credit Losses.” Therefore, we cannot provide
assurance that, in any particular period, we will not have
sizeable credit losses in relation to the amount reserved.
We may need to significantly adjust the allowance for credit
losses, considering current factors at the time, including eco-
nomic or market conditions and ongoing internal and exter-
nal examination processes. Our process for determining the
adequacy of the allowance for credit losses is discussed in
“Financial Review – Critical Accounting Policies – Allowance
for Credit Losses” and Note 6 (Loans and Allowance for
Credit Losses) to Financial Statements.
Asset/Liability and Market Risk Management
Asset/liability management involves the evaluation, monitor-
ing and management of interest rate risk, market risk, liquidity
and funding. The Corporate Asset/Liability Management
Committee (Corporate ALCO)—which oversees these risks
and reports periodically to the Finance Committee of the
Board of Directors—consists of senior financial and business
executives. Each of our principal business groups has its own
asset/liability management committee and process linked to
the Corporate ALCO process.
INTEREST RATE RISK Interest rate risk, which potentially can
have a significant earnings impact, is an integral part of being a
financial intermediary. We are subject to interest rate risk because:
• assets and liabilities may mature or reprice at different
times (for example, if assets reprice faster than liabilities
and interest rates are generally falling, earnings will
initially decline);
Table 21: Allocation of the Allowance for Credit Losses (ACL)
(in millions) December 31,
2008 2007 2006 2005 2004
ACL Loans ACL Loans ACL Loans ACL Loans ACL Loans
as % as % as % as % as %
of total of total of total of total of total
loans loans loans loans loans
Commercial and commercial real estate:
Commercial $ 4,129 23% $1,137 24% $1,051 22% $ 926 20% $ 940 19%
Other real estate mortgage 1,011 12 288 9 225 9 253 9 298 11
Real estate construction 1,023 4 156 5 109 5 115 4 46 3
Lease financing 135 2 51 2 40 2 51 2 30 2
Total commercial and commercial real estate 6,298 41 1,632 40 1,425 38 1,345 35 1,314 35
Consumer:
Real estate 1-4 family first mortgage 4,938 28 415 19 186 17 229 25 150 31
Real estate 1-4 family junior lien mortgage 4,496 13 1,329 20 168 21 118 19 104 18
Credit card 2,463 3 834 5 606 5 508 4 466 4
Other revolving credit and installment 3,251 11 1,164 14 1,434 17 1,060 15 889 11
Total consumer 15,148 55 3,742 58 2,394 60 1,915 63 1,609 64
Foreign 265 4 144 2 145 2 149 2 139 1
Total allocated 21,711 100% 5,518 100% 3,964 100% 3,409 100% 3,062 100%
Unallocated component of allowance — — — 648 888
Total $21,711 $5,518 $3,964 $4,057 $3,950