Wells Fargo 2008 Annual Report Download - page 78
Download and view the complete annual report
Please find page 78 of the 2008 Wells Fargo annual report below. You can navigate through the pages in the report by either clicking on the pages listed below, or by using the keyword search tool below to find specific information within the annual report.-
 1
1 -
2
-
3
-
4
-
5
-
6
-
7
-
8
-
9
-
10
-
11
-
12
-
13
-
14
-
15
-
16
-
17
-
18
-
19
-
20
-
21
-
22
-
23
-
24
-
25
-
26
-
27
-
28
-
29
-
30
-
31
-
32
-
33
-
34
-
35
-
36
-
37
-
38
-
39
-
40
-
41
-
42
-
43
-
44
-
45
-
46
-
47
-
48
-
49
-
50
-
51
-
52
-
53
-
54
-
55
-
56
-
57
-
58
-
59
-
60
-
61
-
62
-
63
-
64
-
65
-
66
-
67
-
 68
68 -
 69
69 -
 70
70 -
 71
71 -
 72
72 -
 73
73 -
 74
74 -
 75
75 -
 76
76 -
 77
77 -
 78
78 -
 79
79 -
 80
80 -
 81
81 -
 82
82 -
 83
83 -
 84
84 -
 85
85 -
 86
86 -
 87
87 -
 88
88 -
89
-
90
-
91
-
92
-
93
-
94
-
95
-
96
-
97
-
98
-
99
-
100
-
101
-
102
-
103
-
104
-
105
-
106
-
107
-
108
-
109
-
110
-
111
-
112
-
113
-
114
-
115
-
116
-
117
-
118
-
119
-
120
-
121
-
122
-
123
-
124
-
125
-
126
-
127
-
128
-
129
-
130
-
131
-
132
-
133
-
134
-
135
-
136
-
137
-
138
-
139
-
140
-
141
-
142
-
143
-
144
-
145
-
146
-
147
-
148
-
149
-
150
-
151
-
152
-
153
-
154
-
155
-
156
-
157
-
158
-
159
-
160
-
161
-
162
-
163
-
164
-
165
-
166
-
167
-
168
-
169
-
170
-
171
-
172
 |
 |

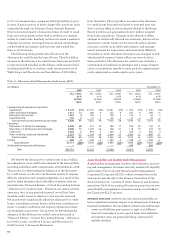
behind a Wells Fargo first mortgage and segregated these
indirect loans into a liquidating portfolio. As previously dis-
closed, while the $11.9 billion of loans in this liquidating port-
folio represented about 3% of total loans outstanding at
December 31, 2007, these loans represented the highest risk
in our $84.2 billion Home Equity portfolio. The loans in the
liquidating portfolio were primarily sourced through whole-
sale (brokers) and correspondents. Additionally, they are
largely concentrated in geographic markets that have experi-
enced the most abrupt and steepest declines in housing
prices. We continued to provide home equity financing
directly to our customers, but stopped originating or acquir-
ing new home equity loans through indirect channels unless
they are behind a Wells Fargo first mortgage and have a
combined loan-to-value ratio lower than 90%. We also experi-
enced increased net charge-offs in our unsecured consumer
portfolios, such as credit cards and lines of credit, in part due
to growth and in part due to increased economic stress in
households.
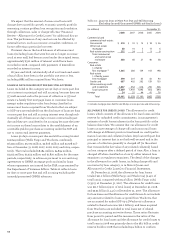
Full year 2007 auto portfolio net charge-offs were $1.02 bil-
lion (3.45% of average loans), compared with $857 million
(3.15%) in 2006. These results were consistent with our expec-
tations and reflected planned lower growth in originations and
an improvement in collection activities within this business.
The provision for credit losses was $4.94 billion in 2007,
an increase of $2.74 billion from $2.20 billion in 2006, due to
higher net charge-offs and the 2007 credit reserve build of
$1.4 billion, primarily for higher net loss content that we esti-
mated in the Home Equity portfolio. The allowance for credit
losses, which consists of the allowance for loan losses and the
reserve for unfunded credit commitments, was $5.52 billion
(1.44% of total loans) at December 31, 2007, compared with
$3.96 billion (1.24%) at December 31, 2006.
At December 31, 2007, total nonaccrual loans were
$2.68 billion (0.70% of total loans) up from $1.67 billion (0.52%)
at December 31, 2006. The majority of the increase in nonac-
crual loans was concentrated in the first mortgage portfolio
($209 million in Wells Fargo Home Mortgage and $343 million
in Wells Fargo Financial) and was due to the national rise in
mortgage default rates. Total NPAs were $3.87 billion (1.01% of
total loans) at December 31, 2007, compared with $2.42 billion
(0.76%) at December 31, 2006. Due to illiquid market conditions,
we are now holding more foreclosed properties than we have
historically. Foreclosed assets were $1.18 billion at December 31,
2007, compared with $745 million at December 31, 2006.
Foreclosed assets, a component of total NPAs, included
$649 million and $423 million in residential property and auto
loans, and $535 million and $322 million of foreclosed real
estate securing GNMA loans at December 31, 2007 and 2006,
respectively, consistent with regulatory reporting require-
ments. The foreclosed real estate securing GNMA loans of
$535 million represented 14 basis points of the ratio of NPAs
to loans at December 31, 2007. Both principal and interest
for the GNMA loans secured by the foreclosed real estate are
collectible because the GNMA loans are insured by the FHA
or guaranteed by the Department of Veterans Affairs.
The Company and each of its subsidiary banks remained
“well capitalized” under applicable regulatory capital adequa-
cy guidelines. The ratio of common stockholders’ equity to
total assets was 8.28% at December 31, 2007, compared with
9.51% at December 31, 2006. Our total RBC ratio at December
31, 2007, was 10.68% and our Tier 1 RBC ratio was 7.59%,
exceeding the minimum regulatory guidelines of 8% and 4%,
respectively, for bank holding companies. Our RBC ratios at
December 31, 2006, were 12.49% and 8.93%, respectively. Our
Tier 1 leverage ratios were 6.83% and 7.88% at December 31,
2007 and 2006, respectively, exceeding the minimum regula-
tory guideline of 3% for bank holding companies.
Risk Factors
An investment in the Company involves risk, including the
possibility that the value of the investment could fall substan-
tially and that dividends or other distributions on the invest-
ment could be reduced or eliminated. We discuss below and
elsewhere in this Report, as well as in other documents we
file with the SEC, risk factors that could adversely affect our
financial results and condition and the value of, and return
on, an investment in the Company. We refer you to the
Financial Review section and Financial Statements (and
related Notes) in this Report for more information about
credit, interest rate, market and litigation risks, and to the
“Regulation and Supervision” section of our 2008 Form 10-K
for more information about legislative and regulatory risks.
Any factor described below or elsewhere in this Report or in
our 2008 Form 10-K could by itself, or together with other fac-
tors, adversely affect our financial results and condition.
Refer to our quarterly reports on Form 10-Q filed with the
SEC in 2009 for material changes to the discussion of risk
factors. There are factors not discussed below or elsewhere in
this Report that could adversely affect our financial results
and condition.
In accordance with the Private Securities Litigation Reform
Act of 1995, we caution you that one or more of these same
risk factors could cause actual results to differ significantly
from projections or forecasts of our financial results and con-
dition and expectations for our operations and business that
we make or express in forward-looking statements in this
Report and in presentations and other Company communica-
tions. We make forward-looking statements when we use
words such as “believe,” “expect,” “anticipate,” “estimate,”
“project,” “forecast,” “will,” “may,” “can” and similar expres-
sions. Do not unduly rely on forward-looking statements, as
actual results could differ significantly. Forward-looking
statements speak only as of the date made, and we do not