Wells Fargo 2008 Annual Report Download - page 168
Download and view the complete annual report
Please find page 168 of the 2008 Wells Fargo annual report below. You can navigate through the pages in the report by either clicking on the pages listed below, or by using the keyword search tool below to find specific information within the annual report.-
 1
1 -
2
-
3
-
4
-
5
-
6
-
7
-
8
-
9
-
10
-
11
-
12
-
13
-
14
-
15
-
16
-
17
-
18
-
19
-
20
-
21
-
22
-
23
-
24
-
25
-
26
-
27
-
28
-
29
-
30
-
31
-
32
-
33
-
34
-
35
-
36
-
37
-
38
-
39
-
40
-
41
-
42
-
43
-
44
-
45
-
46
-
47
-
48
-
49
-
50
-
51
-
52
-
53
-
54
-
55
-
56
-
57
-
58
-
59
-
60
-
61
-
62
-
63
-
64
-
65
-
66
-
67
-
68
-
69
-
70
-
71
-
72
-
73
-
74
-
75
-
76
-
77
-
78
-
79
-
80
-
81
-
82
-
83
-
84
-
85
-
86
-
87
-
88
-
89
-
90
-
91
-
92
-
93
-
94
-
95
-
96
-
97
-
98
-
99
-
100
-
101
-
102
-
103
-
104
-
105
-
106
-
107
-
108
-
109
-
110
-
111
-
112
-
113
-
114
-
115
-
116
-
117
-
118
-
119
-
120
-
121
-
122
-
123
-
124
-
125
-
126
-
127
-
128
-
129
-
130
-
131
-
132
-
133
-
134
-
135
-
136
-
137
-
138
-
139
-
140
-
141
-
142
-
143
-
144
-
145
-
146
-
147
-
148
-
149
-
150
-
151
-
152
-
153
-
154
-
155
-
156
-
157
-
 158
158 -
 159
159 -
 160
160 -
 161
161 -
 162
162 -
 163
163 -
 164
164 -
 165
165 -
 166
166 -
 167
167 -
 168
168 -
 169
169 -
 170
170 -
 171
171 -
 172
172
 |
 |

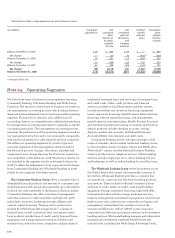
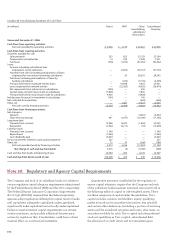
Average Balances, Yields and Rates Paid (Taxable-Equivalent Basis) — Quarterly (1)(2)(3) (Unaudited)
(in millions) Quarter ended December 31,
2008 2007
Average Yields/ Interest Average Yields/ Interest
balance rates income/ balance rates income/
EARNING ASSETS expense expense
Federal funds sold, securities purchased
under resale agreements and other
short-term investments $ 9,938 0.73% $ 18 $ 2,972 4.45% $ 34
Trading assets 5,004 4.50 56 4,248 3.39 37
Debt securities available for sale (4):
Securities of U.S. Treasury and federal agencies 1,165 3.75 11 926 4.18 9
Securities of U.S. states and political subdivisions 7,124 6.73 139 5,995 7.41 110
Mortgage-backed securities:
Federal agencies 51,714 6.07 769 35,434 6.15 534
Private collateralized mortgage obligations 18,245 6.40 402 14,270 5.99 214
Total mortgage-backed securities 69,959 6.18 1,171 49,704 6.11 748
Other debt securities (5) 14,217 8.10 330 8,465 7.45 161
Total debt securities available for sale (5) 92,465 6.50 1,651 65,090 6.38 1,028
Mortgages held for sale (6) 23,390 6.19 362 28,327 6.44 456
Loans held for sale (6) 1,287 4.14 14 965 7.72 19
Loans:
Commercial and commercial real estate:
Commercial 107,325 5.66 1,525 86,958 7.88 1,726
Other real estate mortgage 45,555 5.49 628 35,863 7.22 652
Real estate construction 19,943 4.49 225 18,510 7.35 343
Lease financing 7,397 5.58 103 6,583 5.92 97
Total commercial and commercial real estate 180,220 5.48 2,481 147,914 7.57 2,818
Consumer:
Real estate 1-4 family first mortgage 78,251 6.37 1,247 69,262 7.12 1,235
Real estate 1-4 family junior lien mortgage 75,838 5.85 1,114 75,272 7.92 1,503
Credit card 20,626 12.21 629 17,689 12.79 565
Other revolving credit and installment 52,638 8.35 1,107 56,546 9.54 1,359
Total consumer 227,353 7.19 4,097 218,769 8.48 4,662
Foreign 6,367 9.73 156 7,689 11.55 224
Total loans (6) 413,940 6.48 6,734 374,372 8.18 7,704
Other 1,690 5.37 23 1,552 4.95 17
Total earning assets $ 547,714 6.34 8,858 $477,526 7.75 9,295
FUNDING SOURCES
Deposits:
Interest-bearing checking $ 6,396 0.65 11 $ 5,254 2.96 39
Market rate and other savings 178,301 0.96 430 156,260 2.63 1,035
Savings certificates 41,189 2.66 275 42,560 4.33 465
Other time deposits 8,128 2.74 54 10,874 4.45 122
Deposits in foreign offices 42,771 0.69 75 44,991 4.19 475
Total interest-bearing deposits 276,785 1.22 845 259,939 3.26 2,136
Short-term borrowings 60,210 1.35 204 34,074 4.42 380
Long-term debt 104,112 3.69 964 98,012 5.06 1,245
Total interest-bearing liabilities 441,107 1.82 2,013 392,025 3.81 3,761
Portion of noninterest-bearing funding sources 106,607 — — 85,501 — —
Total funding sources $ 547,714 1.44 2,013 $477,526 3.13 3,761
Net interest margin and net interest income on
a taxable-equivalent basis (7) 4.90% $6,845 4.62% $5,534
NONINTEREST-EARNING ASSETS
Cash and due from banks $ 11,155 $ 12,127
Goodwill 13,544 13,091
Other 60,810 52,903
Total noninterest-earning assets $ 85,509 $ 78,121
NONINTEREST-BEARING FUNDING SOURCES
Deposits $ 91,229 $ 86,632
Other liabilities 30,935 29,019
Preferred stockholders equity 16,116 —
Common stockholders’ equity 53,836 47,971
Noninterest-bearing funding sources used to
fund earning assets (106,607) (85,501)
Net noninterest-bearing funding sources $ 85,509 $ 78,121
TOTAL ASSETS $ 633,223 $555,647
(1) Because the Wachovia acquisition was completed at the end of 2008, Wachovia's assets and liabilities are not included in average balances, and Wachovia's results are not
reflected in interest income/expense.
(2) Our average prime rate was 4.06% and 7.52% for the quarters ended December 31, 2008 and 2007, respectively. The average three-month London Interbank Offered Rate (LIBOR)
was 2.77% and 5.03% for the same quarters, respectively.
(3) Interest rates and amounts include the effects of hedge and risk management activities associated with the respective asset and liability categories.
(4) Yields are based on amortized cost balances computed on a settlement date basis.
(5) Includes certain preferred securities.
(6) Nonaccrual loans and related income are included in their respective loan categories.
(7) Includes taxable-equivalent adjustments primarily related to tax-exempt income on certain loans and securities. The federal statutory tax rate was 35% for both quarters presented.