Wells Fargo 2008 Annual Report Download - page 38
Download and view the complete annual report
Please find page 38 of the 2008 Wells Fargo annual report below. You can navigate through the pages in the report by either clicking on the pages listed below, or by using the keyword search tool below to find specific information within the annual report.-
 1
1 -
2
-
3
-
4
-
5
-
6
-
7
-
8
-
9
-
10
-
11
-
12
-
13
-
14
-
15
-
16
-
17
-
18
-
19
-
20
-
21
-
22
-
23
-
24
-
25
-
26
-
27
-
 28
28 -
 29
29 -
 30
30 -
 31
31 -
 32
32 -
 33
33 -
 34
34 -
 35
35 -
 36
36 -
 37
37 -
 38
38 -
 39
39 -
 40
40 -
 41
41 -
 42
42 -
 43
43 -
 44
44 -
 45
45 -
 46
46 -
 47
47 -
 48
48 -
49
-
50
-
51
-
52
-
53
-
54
-
55
-
56
-
57
-
58
-
59
-
60
-
61
-
62
-
63
-
64
-
65
-
66
-
67
-
68
-
69
-
70
-
71
-
72
-
73
-
74
-
75
-
76
-
77
-
78
-
79
-
80
-
81
-
82
-
83
-
84
-
85
-
86
-
87
-
88
-
89
-
90
-
91
-
92
-
93
-
94
-
95
-
96
-
97
-
98
-
99
-
100
-
101
-
102
-
103
-
104
-
105
-
106
-
107
-
108
-
109
-
110
-
111
-
112
-
113
-
114
-
115
-
116
-
117
-
118
-
119
-
120
-
121
-
122
-
123
-
124
-
125
-
126
-
127
-
128
-
129
-
130
-
131
-
132
-
133
-
134
-
135
-
136
-
137
-
138
-
139
-
140
-
141
-
142
-
143
-
144
-
145
-
146
-
147
-
148
-
149
-
150
-
151
-
152
-
153
-
154
-
155
-
156
-
157
-
158
-
159
-
160
-
161
-
162
-
163
-
164
-
165
-
166
-
167
-
168
-
169
-
170
-
171
-
172
 |
 |
We are among the banking industry’s leaders in increas-
ing loans and assets and remained “open for business” in pro-
viding credit to consumers, small businesses and commercial
customers. Average earning assets, primarily loans and secu-
rities, were up $119 billion, or 28%, since the start of the credit
crisis in mid-2007. We have made $187 billion of new loan
commitments to consumer and commercial customers since
mid-2007. We have originated $354 billion of residential real
estate loans since mid-2007, including $50 billion in fourth
quarter 2008. We have continued to help homeowners remain
in their homes. We delivered over 498,000 solutions to customers
in 2008, including 143,000 in the fourth quarter alone, through
repayment plans, modifications and other loss mitigation
options and are working with government agencies, HOPE
NOW and others. Wells Fargo has led the industry in devel-
opment of programs for at-risk customers to avoid foreclosure.
Among the many products and services that grew in 2008,
we achieved the following results:
• Average loans grew 16%;
• Average core deposits grew 7%; and
• Assets under management were up 45%, including
$510 billion from Wachovia.
We have significantly strengthened the balance sheet and
future earnings stream of the new Wells Fargo. This included
the following actions:
• $37.2 billion of credit write-downs taken at December 31, 2008,
through purchase accounting adjustments on $93.9 billion
of high-risk loans in Wachovia’s loan portfolio
• Reduced the cost basis of the Wachovia securities portfolio
by $9.6 billion, reflecting $2.4 billion of recognized losses
in the fourth quarter and write-off of $7.2 billion of unreal-
ized losses previously reflected in negative cumulative
other comprehensive income
• Additional net $2.9 billion of Wachovia negative cumulative
other comprehensive income written off, primarily related
to pension obligations
• Wachovia period-end loans, securities, trading assets and
loans held for sale reduced by $115.2 billion, or 17%, from
June 30, 2008
• $8.1 billion credit reserve build, including $3.9 billion of
provision to conform to the most conservative methodology
from each company within Federal Financial Institutions
Examination Council (FFIEC) guidelines
– $2.7 billion for Wells Fargo’s consumer portfolios
– $1.2 billion for Wachovia’s commercial and Pick-a-Pay
portfolios
• Wells Fargo securities portfolio written down by
$2.0 billion for other-than-temporary impairment
Our combined allowance for credit losses was $21.7 billion
at December 31, 2008, which represents 3.2 times coverage
of nonaccrual loans. At December 31, 2008, our combined
allowance covered 12 months of estimated losses for all con-
sumer portfolios and at least 24 months for all commercial and
commercial real estate portfolios. As described on page 35, our
nonaccrual loans excluded $20.0 billion of SOP 03-3 loans
that were previously reflected as nonaccrual by Wachovia.
With the acquisition of Wachovia, we have leading market
positions in deposits in many communities in our expanded
banking footprint, including #1 market share in 18 of our 39
combined community banking states and the District of
Columbia. In addition, we are the #1 lender in the following
markets: middle-market companies, commercial real estate,
small business and agriculture, and the #1 commercial real
estate broker and bank-owned insurance broker.
We have stated in the past that to consistently grow over
the long term, successful companies must invest in their core
businesses and maintain strong balance sheets. In addition to
the Wachovia acquisition, we continued to make investments
in 2008 by opening 58 regional banking stores and convert-
ing 32 stores acquired from Greater Bay Bancorp, Farmers
State Bank and United Bancorporation of Wyoming, Inc. to
our network.
We believe it is important to maintain a well-controlled
environment as we continue to grow our businesses. We
manage our credit risk by setting what we believe are sound
credit policies for underwriting new business, while monitor-
ing and reviewing the performance of our loan portfolio. We
manage the interest rate and market risks inherent in our
asset and liability balances within prudent ranges, while
ensuring adequate liquidity and funding. We maintain strong
capital levels to provide for future growth.
At December 31, 2008, consolidated Tier 1 regulatory capi-
tal was $86.4 billion, after the impact of purchase accounting
for credit impairments of loans and write-down of negative
cumulative other comprehensive income at Wachovia, which,
in the aggregate, reduced the Tier 1 capital ratio by approxi-
mately 230 basis points to 7.8% at year end, well above
regulatory minimums for a well-capitalized bank.
The Board of Directors declared a common stock dividend
of $0.34 per share for first quarter 2009.
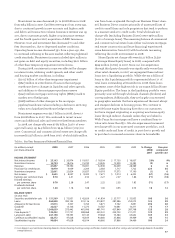
Our financial results included the following:
Net income in 2008 was $2.66 billion ($0.70 per share),
compared with $8.06 billion ($2.38 per share) in 2007. Results
for 2008 included the impact of our $8.1 billion (pre tax) credit
reserve build, which included a $3.9 billion (pre tax) provi-
sion to conform both Wells Fargo’s and Wachovia’s credit
reserve practices to the more conservative of each company.
Results for 2007 included the impact of our $1.4 billion (pre
tax) credit reserve build ($0.27 per share) and $203 million
of Visa litigation expenses ($0.04 per share). Despite the
challenging environment in 2008, we achieved both top line
revenue growth and positive operating leverage (revenue
growth of 6%; expense decline of 1%). ROA was 0.44% and
ROE was 4.79% in 2008, compared with 1.55% and 17.12%,
respectively, in 2007. Both ROA and ROE were at or near
the top of our large bank peers.
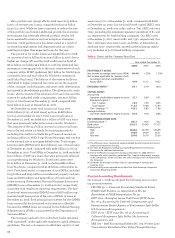
Net interest income on a taxable-equivalent basis was
$25.4 billion in 2008, up from $21.1 billion a year ago, reflect-
ing strong loan growth, disciplined deposit pricing and lower
market funding costs. Average earning assets grew 17% from
2007. Our net interest margin was 4.83% for 2008, up from
4.74% in 2007, primarily due to the benefit of lower funding
costs as market rates declined.