Wells Fargo 2008 Annual Report Download - page 69
Download and view the complete annual report
Please find page 69 of the 2008 Wells Fargo annual report below. You can navigate through the pages in the report by either clicking on the pages listed below, or by using the keyword search tool below to find specific information within the annual report.-
 1
1 -
2
-
3
-
4
-
5
-
6
-
7
-
8
-
9
-
10
-
11
-
12
-
13
-
14
-
15
-
16
-
17
-
18
-
19
-
20
-
21
-
22
-
23
-
24
-
25
-
26
-
27
-
28
-
29
-
30
-
31
-
32
-
33
-
34
-
35
-
36
-
37
-
38
-
39
-
40
-
41
-
42
-
43
-
44
-
45
-
46
-
47
-
48
-
49
-
50
-
51
-
52
-
53
-
54
-
55
-
56
-
57
-
58
-
 59
59 -
 60
60 -
 61
61 -
 62
62 -
 63
63 -
 64
64 -
 65
65 -
 66
66 -
 67
67 -
 68
68 -
 69
69 -
 70
70 -
 71
71 -
 72
72 -
 73
73 -
 74
74 -
 75
75 -
 76
76 -
 77
77 -
 78
78 -
 79
79 -
80
-
81
-
82
-
83
-
84
-
85
-
86
-
87
-
88
-
89
-
90
-
91
-
92
-
93
-
94
-
95
-
96
-
97
-
98
-
99
-
100
-
101
-
102
-
103
-
104
-
105
-
106
-
107
-
108
-
109
-
110
-
111
-
112
-
113
-
114
-
115
-
116
-
117
-
118
-
119
-
120
-
121
-
122
-
123
-
124
-
125
-
126
-
127
-
128
-
129
-
130
-
131
-
132
-
133
-
134
-
135
-
136
-
137
-
138
-
139
-
140
-
141
-
142
-
143
-
144
-
145
-
146
-
147
-
148
-
149
-
150
-
151
-
152
-
153
-
154
-
155
-
156
-
157
-
158
-
159
-
160
-
161
-
162
-
163
-
164
-
165
-
166
-
167
-
168
-
169
-
170
-
171
-
172
 |
 |
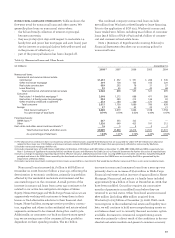
estimated loss emergence coverage periods to the most
conservative of each company within FFIEC guidelines as
described below. The reserve for unfunded credit commit-
ments was $698 million at December 31, 2008, and $211 million
at December 31, 2007.
The ratio of the allowance for credit losses to total nonac-
crual loans was 319% and 206% at December 31, 2008 and
2007, respectively. The increase in this ratio reflects the addi-
tion of $9.3 billion (including $1.5 billion of conforming and
purchase accounting adjustments) of Wachovia allowance for
credit losses, but excludes $20.0 billion of SOP 03-3 loans that
were previously reflected as nonaccrual by Wachovia. This
ratio may fluctuate significantly from period to period due to
such factors as the mix of loan types in the portfolio, borrow-
er credit strength and the value and marketability of collater-
al. Over half of nonaccrual loans were home mortgages, auto
and other consumer loans at December 31, 2008. Nonaccrual
loans are generally written down to fair value less cost to sell
at the time they are placed on nonaccrual and accounted for
on a cost recovery basis.
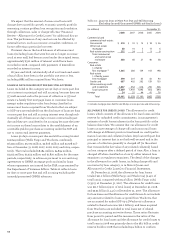
The ratio of the allowance for loan losses to annual net
charge-offs was 268%, 150% and 175% at December 31, 2008,
2007 and 2006, respectively. The increase in this ratio pri-
marily relates to the addition of $8.7 billion (including $1.2
billion of conforming adjustments) from Wachovia while net
charge-offs do not include any amounts from Wachovia as
the acquisition closed at year end. This ratio may fluctuate
significantly from period to period due to many factors,
including general economic conditions, customer credit
strength and the marketability of collateral. While we consid-
er the ratio of the allowance for loan losses to annual net
charge-offs, such trends are not determinative in and of
themselves, as we use several analytical tools in determining
the adequacy of the allowance for loan losses. The allowance
for loan losses reflects management’s estimate of credit losses
inherent in the loan portfolio based on loss emergence peri-
ods of the respective loans, underlying economic and market
conditions, among other factors. See “Critical Accounting
Policies – Allowance for Credit Losses” for additional infor-
mation. The allowance for loan losses at December 31, 2008,
also includes the allowance acquired from the Wachovia
acquisition, while 2008 net charge-offs do not include activity
related to Wachovia.
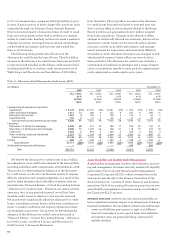
The provision for credit losses totaled $16.0 billion in 2008,
$4.9 billion in 2007 and $2.2 billion in 2006. In 2008, the pro-
vision included a credit reserve build of $8.1 billion in excess
of net charge-offs, which included $3.9 billion to conform loss
emergence coverage periods to the most conservative of each
company within FFIEC guidelines. Of the $3.9 billion, $2.7 bil-
lion related to Wells Fargo consumer loans to extend the loss
emergence period to 12 months of estimated incurred losses
for all consumer portfolios, a period which is FFIEC compliant
and which best fits the projected loss emergence period of the
combined company’s consumer loan portfolio, and is consis-
tent with Wells Fargo consumer loan portfolio loss emer-
gence trends reflecting our increased loss mitigation efforts.
The remaining $1.2 billion conforming adjustment was
related to an increase in the allowance for loan losses for
legacy Wachovia commercial and Pick-a-Pay portfolios to
align with the respective Wells Fargo methodology. The
remainder of the reserve build was attributable to higher pro-
jected loss rates across the majority of the consumer credit
businesses, and some credit deterioration and growth in the
wholesale portfolios. In 2007, the provision included $1.4 bil-
lion in excess of net charge-offs, which was our estimate of
the increase in incurred losses in our loan portfolio at year-
end 2007, primarily related to the Home Equity portfolio.
Net charge-offs in 2008 were 1.97% of average total loans,
compared with 1.03% in 2007 and 0.73% in 2006. Home Equity
net charge-offs totaled $2.2 billion (2.59% of average Home
Equity loans) in 2008, a $1.6 billion increase from $595 mil-
lion (0.73%) in 2007. The increase was primarily due to loans
in geographic markets that have experienced the most abrupt
and steepest declines in housing prices coupled with a deteri-
orating economic environment impacting our customers.
Since our loss experience through third party channels pro-
duced unexpectedly high results, we segregated these loans
into a liquidating portfolio. As previously disclosed, while the
$10.3 billion of loans in this liquidating portfolio represented
about 1% of total loans outstanding at December 31, 2008,
these loans represent some of the highest risk in our
$129.5 billion Home Equity portfolios. The loans in the liqui-
dating portfolio were primarily sourced through wholesale
(brokers) and correspondents. Our real estate 1-4 family first
mortgage portfolio began to experience credit deterioration
in 2008 given the continued decline in housing prices and the
economic environment, with net charge-offs of $503 million
(0.67% of average loans) for 2008, up from $87 million (0.14%)
for 2007.
Although credit quality in Wells Fargo Financial’s real
estate-secured lending business has deteriorated, we have not
experienced the level of credit degradation that many non-
prime lenders have because of our disciplined underwriting
practices. Wells Fargo Financial has continued its long-stand-
ing practice not to use brokers or correspondents in its U.S.
debt consolidation business.
Auto portfolio net charge-offs for 2008 were $1.23 billion
(4.50% of average auto loans), compared with $1.02 billion
(3.45%) in 2007. While we have continued to reduce the size
of this portfolio and limited additional growth, the economic
environment has adversely affected portfolio results. We
have remained focused on our loss mitigation strategies,
however, credit performance has deteriorated as a result of
increased unemployment and depressed used car values,
resulting in higher than expected losses for the year.
Consumer credit card net charge-offs for 2008 were
$1.42 billion (7.22% of average credit card loans), compared
with $712 million (4.49%) in 2007. The increase in credit card
net charge-offs was due to an overall weakening in the economy
and its impact to our customers.
Credit performance in the commercial and commercial real
estate portfolio showed signs of deterioration given the current
economic environment, with net charge-offs of $1.79 billion