Wells Fargo 2008 Annual Report Download - page 39
Download and view the complete annual report
Please find page 39 of the 2008 Wells Fargo annual report below. You can navigate through the pages in the report by either clicking on the pages listed below, or by using the keyword search tool below to find specific information within the annual report.-
 1
1 -
2
-
3
-
4
-
5
-
6
-
7
-
8
-
9
-
10
-
11
-
12
-
13
-
14
-
15
-
16
-
17
-
18
-
19
-
20
-
21
-
22
-
23
-
24
-
25
-
26
-
27
-
28
-
 29
29 -
 30
30 -
 31
31 -
 32
32 -
 33
33 -
 34
34 -
 35
35 -
 36
36 -
 37
37 -
 38
38 -
 39
39 -
 40
40 -
 41
41 -
 42
42 -
 43
43 -
 44
44 -
 45
45 -
 46
46 -
 47
47 -
 48
48 -
 49
49 -
50
-
51
-
52
-
53
-
54
-
55
-
56
-
57
-
58
-
59
-
60
-
61
-
62
-
63
-
64
-
65
-
66
-
67
-
68
-
69
-
70
-
71
-
72
-
73
-
74
-
75
-
76
-
77
-
78
-
79
-
80
-
81
-
82
-
83
-
84
-
85
-
86
-
87
-
88
-
89
-
90
-
91
-
92
-
93
-
94
-
95
-
96
-
97
-
98
-
99
-
100
-
101
-
102
-
103
-
104
-
105
-
106
-
107
-
108
-
109
-
110
-
111
-
112
-
113
-
114
-
115
-
116
-
117
-
118
-
119
-
120
-
121
-
122
-
123
-
124
-
125
-
126
-
127
-
128
-
129
-
130
-
131
-
132
-
133
-
134
-
135
-
136
-
137
-
138
-
139
-
140
-
141
-
142
-
143
-
144
-
145
-
146
-
147
-
148
-
149
-
150
-
151
-
152
-
153
-
154
-
155
-
156
-
157
-
158
-
159
-
160
-
161
-
162
-
163
-
164
-
165
-
166
-
167
-
168
-
169
-
170
-
171
-
172
 |
 |

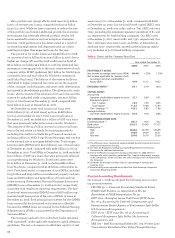
Noninterest income decreased 9% to $16.8 billion in 2008
from $18.4 billion in 2007. Card fees were up 9% from a year ago,
due to continued growth in new accounts and higher credit
and debit card transaction volume. Insurance revenue was up
20%, due to customer growth, higher crop insurance revenue
and the fourth quarter 2007 acquisition of ABD Insurance.
However, trust and investment fees decreased 7% and other
fees decreased 9%, due to depressed market conditions.
Operating lease income decreased 39% from a year ago, due
to continued softening in the auto market, reflecting tightened
credit standards. Noninterest income included $300 million in
net gains on debt and equity securities, including $2.01 billion
of other-than-temporary impairment write-downs.
During 2008, noninterest income was affected by changes
in interest rates, widening credit spreads, and other credit
and housing market conditions, including:
• ($2.01) billion of other-than-temporary impairment
• ($847) million in write-downs of loans in the mortgage
warehouse due to changes in liquidity and other spreads,
and additions to the mortgage repurchase reserve
• ($242) million mortgage servicing rights (MSRs) mark to
market, net of hedge gain
• ($228) million of other changes in the mortgage
pipeline/warehouse value including a decline in servicing
value, net of pipeline/warehouse hedge results
Noninterest expense was $22.7 billion in 2008, down 1%
from $22.8 billion in 2007. We continued to invest in new
stores and additional sales and service-related team members.
In 2008, net charge-offs were $7.84 billion (1.97% of aver-
age total loans), up $4.3 billion from $3.54 billion (1.03%) in
2007. Commercial and commercial real estate net charge-offs
increased $1.25 billion in 2008 from 2007, of which $379 million
was from loans originated through our Business Direct chan-
nel. Business Direct consists primarily of unsecured lines of
credit to small firms and sole proprietors that tend to perform
in a manner similar to credit cards. Total wholesale net
charge-offs (excluding Business Direct) were $967 million
(0.11% of average loans). The remaining balance of commercial
and commercial real estate loans (other real estate mortgage,
real estate construction and lease financing) experienced
some deterioration from 2007 with loss levels increasing,
reflecting the credit environment in 2008.
Home Equity net charge-offs were $2.21 billion (2.59%
of average Home Equity loans) in 2008, compared with
$595 million (0.73%) in 2007. Since our loss experience
through third party channels was significantly worse than
other retail channels, in 2007 we segregated these indirect
loans into a liquidating portfolio. While the $10.3 billion of
loans in this liquidating portfolio represented about 1% of
total loans outstanding at December 31, 2008, these loans
represent some of the highest risk in our $129.5 billion Home
Equity portfolios. The loans in the liquidating portfolio were
primarily sourced through wholesale channels (brokers) and
correspondents. Additionally, they are largely concentrated
in geographic markets that have experienced the most abrupt
and steepest declines in housing prices. We continue to
provide home equity financing directly to our customers,
but have stopped originating or acquiring new home equity
loans through indirect channels unless they are behind a
Wells Fargo first mortgage and have a combined loan-to-
value ratio lower than 85%. We also experienced increased
net charge-offs in our unsecured consumer portfolios, such
as credit cards and lines of credit, in part due to growth and
in part due to increased economic stress in households.
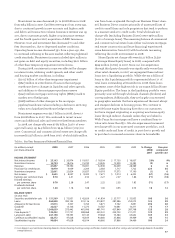
Table 1: Six-Year Summary of Selected Financial Data
(in millions, except 2008 2007 2006 2005 2004 2003 % Change Five-year
per share amounts) 2008/ compound
2007 growth rate
INCOME STATEMENT
Net interest income $ 25,143 $ 20,974 $ 19,951 $ 18,504 $ 17,150 $ 16,007 20% 9%
Noninterest income 16,754 18,416 15,740 14,445 12,909 12,382 (9) 6
Revenue 41,897 39,390 35,691 32,949 30,059 28,389 68
Provision for credit losses 15,979 4,939 2,204 2,383 1,717 1,722 224 56
Noninterest expense 22,661 22,824 20,837 19,018 17,573 17,190 (1) 6
Net income $ 2,655 $ 8,057 $ 8,420 $ 7,671 $ 7,014 $ 6,202 (67) (16)
Earnings per common share 0.70 2.41 2.50 2.27 2.07 1.84 (71) (18)
Diluted earnings
per common share 0.70 2.38 2.47 2.25 2.05 1.83 (71) (17)
Dividends declared
per common share 1.30 1.18 1.08 1.00 0.93 0.75 10 12
BALANCE SHEET
(at year end)
Securities available for sale $ 151,569 $ 72,951 $ 42,629 $ 41,834 $ 33,717 $ 32,953 108 36
Loans 864,830 382,195 319,116 310,837 287,586 253,073 126 28
Allowance for loan losses 21,013 5,307 3,764 3,871 3,762 3,891 296 40
Goodwill 22,627 13,106 11,275 10,787 10,681 10,371 73 17
Assets 1,309,639 575,442 481,996 481,741 427,849 387,798 128 28
Core deposits (1) 745,432 311,731 288,068 253,341 229,703 211,271 139 29
Long-term debt 267,158 99,393 87,145 79,668 73,580 63,642 169 33
Common stockholders’ equity 68,272 47,628 45,814 40,660 37,866 34,469 43 15
Stockholders’ equity 99,084 47,628 45,814 40,660 37,866 34,469 108 24
(1) Core deposits are noninterest-bearing deposits, interest-bearing checking, savings certificates, market rate and other savings, and certain foreign deposits (Eurodollar
sweep balances).