Wells Fargo 2008 Annual Report Download - page 164
Download and view the complete annual report
Please find page 164 of the 2008 Wells Fargo annual report below. You can navigate through the pages in the report by either clicking on the pages listed below, or by using the keyword search tool below to find specific information within the annual report.-
 1
1 -
2
-
3
-
4
-
5
-
6
-
7
-
8
-
9
-
10
-
11
-
12
-
13
-
14
-
15
-
16
-
17
-
18
-
19
-
20
-
21
-
22
-
23
-
24
-
25
-
26
-
27
-
28
-
29
-
30
-
31
-
32
-
33
-
34
-
35
-
36
-
37
-
38
-
39
-
40
-
41
-
42
-
43
-
44
-
45
-
46
-
47
-
48
-
49
-
50
-
51
-
52
-
53
-
54
-
55
-
56
-
57
-
58
-
59
-
60
-
61
-
62
-
63
-
64
-
65
-
66
-
67
-
68
-
69
-
70
-
71
-
72
-
73
-
74
-
75
-
76
-
77
-
78
-
79
-
80
-
81
-
82
-
83
-
84
-
85
-
86
-
87
-
88
-
89
-
90
-
91
-
92
-
93
-
94
-
95
-
96
-
97
-
98
-
99
-
100
-
101
-
102
-
103
-
104
-
105
-
106
-
107
-
108
-
109
-
110
-
111
-
112
-
113
-
114
-
115
-
116
-
117
-
118
-
119
-
120
-
121
-
122
-
123
-
124
-
125
-
126
-
127
-
128
-
129
-
130
-
131
-
132
-
133
-
134
-
135
-
136
-
137
-
138
-
139
-
140
-
141
-
142
-
143
-
144
-
145
-
146
-
147
-
148
-
149
-
150
-
151
-
152
-
153
-
 154
154 -
 155
155 -
 156
156 -
 157
157 -
 158
158 -
 159
159 -
 160
160 -
 161
161 -
 162
162 -
 163
163 -
 164
164 -
 165
165 -
 166
166 -
 167
167 -
 168
168 -
 169
169 -
 170
170 -
 171
171 -
 172
172
 |
 |

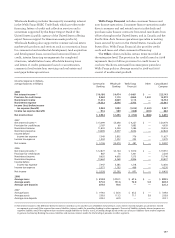
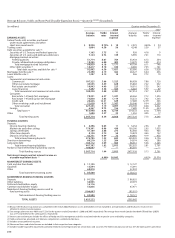
Condensed Consolidating Statement of Cash Flows
(in millions) Parent WFFI Other Consolidated
consolidating Company
subsidiaries/
eliminations
Year ended December 31, 2006
Cash flows from operating activities:
Net cash provided by operating activities $ 3,536 $ 1,179 $ 23,261 $ 27,976
Cash flows from investing activities:
Securities available for sale:
Sales proceeds 353 822 52,129 53,304
Prepayments and maturities 14 259 7,048 7,321
Purchases (378) (1,032) (61,052) (62,462)
Loans:
Increase in banking subsidiaries’ loan
originations, net of collections — (2,003) (35,727) (37,730)
Proceeds from sales (including participations) of loans
originated for investment by banking subsidiaries — 50 38,293 38,343
Purchases (including participations) of loans by
banking subsidiaries — (202) (5,136) (5,338)
Principal collected on nonbank entities’ loans — 19,998 3,923 23,921
Loans originated by nonbank entities — (22,382) (4,592) (26,974)
Net repayments from (advances to) subsidiaries (500) — 500 —
Capital notes and term loans made to subsidiaries (7,805) — 7,805 —
Principal collected on notes/loans made to subsidiaries 4,926 — (4,926) —
Net decrease (increase) in investment in subsidiaries (145) — 145 —
Net cash paid for acquisitions — — (626) (626)
Other, net — 1,081 (7,422) (6,341)
Net cash used by investing activities (3,535) (3,409) (9,638) (16,582)
Cash flows from financing activities:
Net change in:
Deposits — — (4,452) (4,452)
Short-term borrowings 931 (1,297) (10,790) (11,156)
Long-term debt:
Proceeds from issuance 13,448 8,670 (1,863) 20,255
Repayment (7,362) (5,217) (30) (12,609)
Common stock:
Proceeds from issuance 1,764 — — 1,764
Repurchased (1,965) — — (1,965)
Cash dividends paid (3,641) — — (3,641)
Excess tax benefits related to stock option payments 227 — — 227
Other, net 12 70 (268) (186)
Net cash provided (used) by financing activities 3,414 2,226 (17,403) (11,763)
Net change in cash and due from banks 3,415 (4) (3,780) (369)
Cash and due from banks at beginning of year 10,794 474 4,129 15,397
Cash and due from banks at end of year $14,209 $ 470 $ 349 $ 15,028
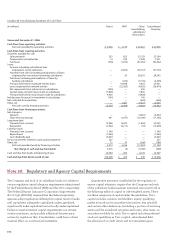
Note 26: Regulatory and Agency Capital Requirements
The Company and each of its subsidiary banks are subject to
various regulatory capital adequacy requirements administered
by the Federal Reserve Board (FRB) and the OCC, respectively.
The Federal Deposit Insurance Corporation Improvement
Act of 1991 (FDICIA) required that the federal regulatory
agencies adopt regulations defining five capital tiers for banks:
well capitalized, adequately capitalized, undercapitalized,
significantly undercapitalized and critically undercapitalized.
Failure to meet minimum capital requirements can initiate
certain mandatory, and possibly additional discretionary,
actions by regulators that, if undertaken, could have a direct
material effect on our financial statements.
Quantitative measures, established by the regulators to
ensure capital adequacy, require that the Company and each
of the subsidiary banks maintain minimum ratios (set forth in
the following table) of capital to risk-weighted assets. There
are three categories of capital under the guidelines. Tier 1
capital includes common stockholders’ equity, qualifying
preferred stock and trust preferred securities, less goodwill
and certain other deductions (including a portion of servicing
assets and the unrealized net gains and losses, after taxes, on
securities available for sale). Tier 2 capital includes preferred
stock not qualifying as Tier 1 capital, subordinated debt,
the allowance for credit losses and net unrealized gains