Wells Fargo 2008 Annual Report Download - page 57
Download and view the complete annual report
Please find page 57 of the 2008 Wells Fargo annual report below. You can navigate through the pages in the report by either clicking on the pages listed below, or by using the keyword search tool below to find specific information within the annual report.-
 1
1 -
2
-
3
-
4
-
5
-
6
-
7
-
8
-
9
-
10
-
11
-
12
-
13
-
14
-
15
-
16
-
17
-
18
-
19
-
20
-
21
-
22
-
23
-
24
-
25
-
26
-
27
-
28
-
29
-
30
-
31
-
32
-
33
-
34
-
35
-
36
-
37
-
38
-
39
-
40
-
41
-
42
-
43
-
44
-
45
-
46
-
 47
47 -
 48
48 -
 49
49 -
 50
50 -
 51
51 -
 52
52 -
 53
53 -
 54
54 -
 55
55 -
 56
56 -
 57
57 -
 58
58 -
 59
59 -
 60
60 -
 61
61 -
 62
62 -
 63
63 -
 64
64 -
 65
65 -
 66
66 -
 67
67 -
68
-
69
-
70
-
71
-
72
-
73
-
74
-
75
-
76
-
77
-
78
-
79
-
80
-
81
-
82
-
83
-
84
-
85
-
86
-
87
-
88
-
89
-
90
-
91
-
92
-
93
-
94
-
95
-
96
-
97
-
98
-
99
-
100
-
101
-
102
-
103
-
104
-
105
-
106
-
107
-
108
-
109
-
110
-
111
-
112
-
113
-
114
-
115
-
116
-
117
-
118
-
119
-
120
-
121
-
122
-
123
-
124
-
125
-
126
-
127
-
128
-
129
-
130
-
131
-
132
-
133
-
134
-
135
-
136
-
137
-
138
-
139
-
140
-
141
-
142
-
143
-
144
-
145
-
146
-
147
-
148
-
149
-
150
-
151
-
152
-
153
-
154
-
155
-
156
-
157
-
158
-
159
-
160
-
161
-
162
-
163
-
164
-
165
-
166
-
167
-
168
-
169
-
170
-
171
-
172
 |
 |

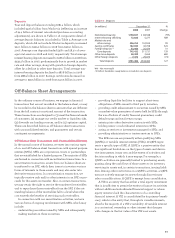
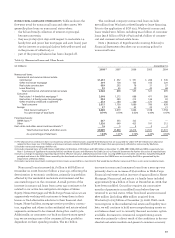
Table 10: Deposits
(in millions) December 31,%
2008 2007 Change
Noninterest-bearing $150,837 $ 84,348 79%
Interest-bearing checking 72,828 5,277 NM
Market rate and
other savings 306,255 153,924 99
Savings certificates 182,043 42,708 326
Foreign deposits (1) 33,469 25,474 31
Core deposits 745,432 311,731 139
Other time deposits 28,498 3,654 680
Other foreign deposits 7,472 29,075 (74)
Total deposits $781,402 $344,460 127
NM – Not meaningful
(1) Reflects Eurodollar sweep balances included in core deposits.
Off-Balance Sheet Arrangements
In the ordinary course of business, we engage in financial
transactions that are not recorded in the balance sheet, or may
be recorded in the balance sheet in amounts that are different
from the full contract or notional amount of the transaction.
These transactions are designed to (1) meet the financial needs
of customers, (2) manage our credit, market or liquidity risks,
(3) diversify our funding sources, and/or (4) optimize capital.
These are described below as off-balance sheet transactions
with unconsolidated entities, and guarantees and certain
contingent arrangements.
Off-Balance Sheet Transactions with Unconsolidated Entities
In the normal course of business, we enter into various types
of on- and off-balance sheet transactions with special purpose
entities (SPEs). SPEs are corporations, trusts or partnerships
that are established for a limited purpose. The majority of SPEs
are formed in connection with securitization transactions. In a
securitization transaction, assets from our balance sheet are
transferred to an SPE, which then issues to investors various
forms of interests in those assets and may also enter into
derivative transactions. In a securitization transaction, we
typically receive cash and/or other interests in an SPE as pro-
ceeds for the assets we transfer. Also, in certain transactions,
we may retain the right to service the transferred receivables
and to repurchase those receivables from the SPE if the out-
standing balance of the receivables fall to a level where the
cost exceeds the benefits of servicing such receivables.
In connection with our securitization activities, we have
various forms of ongoing involvement with SPEs, which may
include:
• underwriting securities issued by SPEs and subsequently
making markets in those securities;
• providing liquidity facilities to support short-term
obligations of SPEs issued to third party investors;
• providing credit enhancement to securities issued by SPEs
or market value guarantees of assets held by SPEs through
the use of letters of credit, financial guarantees, credit
default swaps and total return swaps;
• entering into other derivative contracts with SPEs;
• holding senior or subordinated interests in SPEs;
• acting as servicer or investment manager for SPEs; and
• providing administrative or trustee services to SPEs.
The SPEs we use are primarily either qualifying SPEs
(QSPEs) or variable interest entities (VIEs). A QSPE repre-
sents a specific type of SPE. A QSPE is a passive entity that
has significant limitations on the types of assets and deriva-
tive instruments it may own and the extent of activities and
decision making in which it may engage. For example, a
QSPE’s activities are generally limited to purchasing assets,
passing along the cash flows of those assets to its investors,
servicing its assets and, in certain transactions, issuing liabil-
ities. Among other restrictions on a QSPE’s activities, a QSPE
may not actively manage its assets through discretionary
sales or modifications. A QSPE is exempt from consolidation.
A VIE is an entity that has either a total equity investment
that is insufficient to permit the entity to finance its activities
without additional subordinated financial support or whose
equity investors lack the characteristics of a controlling
financial interest. A VIE is consolidated by its primary benefi-
ciary, which is the entity that, through its variable interests,
absorbs the majority of a VIE’s variability. A variable interest
is a contractual, ownership or other interest that changes
with changes in the fair value of the VIE’s net assets.
Deposits
Year-end deposit balances totaling $781.4 billion, which
included $426.2 billion from Wachovia (reflecting an increase
of $4.4 billion of interest rate related purchase accounting
adjustments), are shown in Table 10. A comparative detail of
average deposit balances is included in Table 3. Average core
deposits, which did not include Wachovia deposits, increased
$22.1 billion to $325.2 billion in 2008 from $303.1 billion in
2007. Average core deposits funded 53.8% and 58.2% of aver-
age total assets in 2008 and 2007, respectively. Total average
interest-bearing deposits increased to $266.1 billion in 2008 from
$239.2 billion in 2007, predominantly due to growth in market
rate and other savings, along with growth in foreign deposits,
offset by a decline in other time deposits. Total average non-
interest-bearing deposits declined to $87.8 billion in 2008
from $88.9 billion in 2007. Savings certificates decreased on
average to $39.5 billion in 2008 from $40.5 billion in 2007.