Wells Fargo 2008 Annual Report Download - page 157
Download and view the complete annual report
Please find page 157 of the 2008 Wells Fargo annual report below. You can navigate through the pages in the report by either clicking on the pages listed below, or by using the keyword search tool below to find specific information within the annual report.-
 1
1 -
2
-
3
-
4
-
5
-
6
-
7
-
8
-
9
-
10
-
11
-
12
-
13
-
14
-
15
-
16
-
17
-
18
-
19
-
20
-
21
-
22
-
23
-
24
-
25
-
26
-
27
-
28
-
29
-
30
-
31
-
32
-
33
-
34
-
35
-
36
-
37
-
38
-
39
-
40
-
41
-
42
-
43
-
44
-
45
-
46
-
47
-
48
-
49
-
50
-
51
-
52
-
53
-
54
-
55
-
56
-
57
-
58
-
59
-
60
-
61
-
62
-
63
-
64
-
65
-
66
-
67
-
68
-
69
-
70
-
71
-
72
-
73
-
74
-
75
-
76
-
77
-
78
-
79
-
80
-
81
-
82
-
83
-
84
-
85
-
86
-
87
-
88
-
89
-
90
-
91
-
92
-
93
-
94
-
95
-
96
-
97
-
98
-
99
-
100
-
101
-
102
-
103
-
104
-
105
-
106
-
107
-
108
-
109
-
110
-
111
-
112
-
113
-
114
-
115
-
116
-
117
-
118
-
119
-
120
-
121
-
122
-
123
-
124
-
125
-
126
-
127
-
128
-
129
-
130
-
131
-
132
-
133
-
134
-
135
-
136
-
137
-
138
-
139
-
140
-
141
-
142
-
143
-
144
-
145
-
146
-
 147
147 -
 148
148 -
 149
149 -
 150
150 -
 151
151 -
 152
152 -
 153
153 -
 154
154 -
 155
155 -
 156
156 -
 157
157 -
 158
158 -
 159
159 -
 160
160 -
 161
161 -
 162
162 -
 163
163 -
 164
164 -
 165
165 -
 166
166 -
 167
167 -
168
-
169
-
170
-
171
-
172
 |
 |

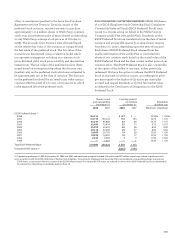
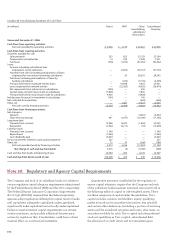
(in millions) Year ended December 31,
2008 2007 2006
Before Tax Net of Before Tax Net of Before Tax Net of
tax effect tax tax effect tax tax effect tax
Translation adjustments $ (93)$ (35)$ (58)$ 36 $ 13 $ 23 $ — $ — $ —
Securities available for sale:
Net unrealized gains (losses)
arising during the year (10,546) (3,958) (6,588) 86 36 50 264 93 171
Reclassification of gains
included in net income (35) (13) (22) (345) (131) (214) (326) (124) (202)
Net unrealized losses arising
during the year (10,581) (3,971) (6,610) (259) (95) (164) (62) (31) (31)
Derivatives and
hedging activities:
Net unrealized gains
arising during the year 955 363 592 645 246 399 46 16 30
Reclassification of net losses
(gains) on cash flow hedges
included in net income (252) (96) (156) (124) (47) (77) 64 24 40
Net unrealized gains arising
during the year 703 267 436 521 199 322 110 40 70
Defined benefit pension plans:
Net actuarial gain (loss) (2,165) (799) (1,366) 347 132 215 — — —
Amortization of net actuarial (gain)
loss and prior service cost
included in net income 6 2 4 44 17 27 — — —
Net gains (losses) arising
during the year (2,159) (797) (1,362) 391 149 242 — — —
Other comprehensive income $(12,130) $(4,536) $(7,594) $ 689 $ 266 $ 423 $ 48 $ 9 $ 39
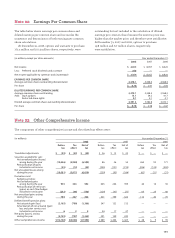
Note 23: Other Comprehensive Income
The components of other comprehensive income and the related tax effects were:
(in millions, except per share amounts) Year ended December 31,
2008 2007 2006
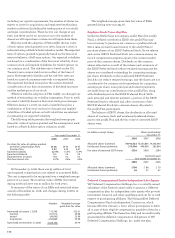
Net income $ 2,655 $ 8,057 $ 8,420
Less: Preferred stock dividends and accretion 286 — —
Net income applicable to common stock (numerator) $ 2,369 $ 8,057 $ 8,420
EARNINGS PER COMMON SHARE
Average common shares outstanding (denominator) 3,378.1 3,348.5 3,368.3
Per share $0.70 $ 2.41 $ 2.50
DILUTED EARNINGS PER COMMON SHARE
Average common shares outstanding 3,378.1 3,348.5 3,368.3
Add: Stock options 13.1 34.2 41.7
Restricted share rights 0.1 0.1 0.1
Diluted average common shares outstanding (denominator) 3,391.3 3,382.8 3,410.1
Per share $0.70 $ 2.38 $ 2.47
The table below shows earnings per common share and
diluted earnings per common share and reconciles the
numerator and denominator of both earnings per common
share calculations.
At December 31, 2008, options and warrants to purchase
172.4 million and 110.3 million shares, respectively, were
Note 22: Earnings Per Common Share
outstanding but not included in the calculation of diluted
earnings per common share because the exercise price was
higher than the market price, and therefore were antidilutive.
At December 31, 2007 and 2006, options to purchase
13.8 million and 6.7 million shares, respectively,
were antidilutive.