Wells Fargo 2008 Annual Report Download - page 90
Download and view the complete annual report
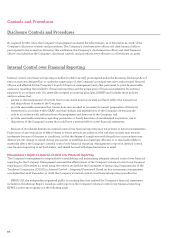
Please find page 90 of the 2008 Wells Fargo annual report below. You can navigate through the pages in the report by either clicking on the pages listed below, or by using the keyword search tool below to find specific information within the annual report.-
 1
1 -
2
-
3
-
4
-
5
-
6
-
7
-
8
-
9
-
10
-
11
-
12
-
13
-
14
-
15
-
16
-
17
-
18
-
19
-
20
-
21
-
22
-
23
-
24
-
25
-
26
-
27
-
28
-
29
-
30
-
31
-
32
-
33
-
34
-
35
-
36
-
37
-
38
-
39
-
40
-
41
-
42
-
43
-
44
-
45
-
46
-
47
-
48
-
49
-
50
-
51
-
52
-
53
-
54
-
55
-
56
-
57
-
58
-
59
-
60
-
61
-
62
-
63
-
64
-
65
-
66
-
67
-
68
-
69
-
70
-
71
-
72
-
73
-
74
-
75
-
76
-
77
-
78
-
79
-
 80
80 -
 81
81 -
 82
82 -
 83
83 -
 84
84 -
 85
85 -
 86
86 -
 87
87 -
 88
88 -
 89
89 -
 90
90 -
 91
91 -
 92
92 -
 93
93 -
 94
94 -
 95
95 -
 96
96 -
 97
97 -
 98
98 -
 99
99 -
 100
100 -
101
-
102
-
103
-
104
-
105
-
106
-
107
-
108
-
109
-
110
-
111
-
112
-
113
-
114
-
115
-
116
-
117
-
118
-
119
-
120
-
121
-
122
-
123
-
124
-
125
-
126
-
127
-
128
-
129
-
130
-
131
-
132
-
133
-
134
-
135
-
136
-
137
-
138
-
139
-
140
-
141
-
142
-
143
-
144
-
145
-
146
-
147
-
148
-
149
-
150
-
151
-
152
-
153
-
154
-
155
-
156
-
157
-
158
-
159
-
160
-
161
-
162
-
163
-
164
-
165
-
166
-
167
-
168
-
169
-
170
-
171
-
172
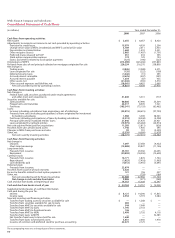
 |
 |

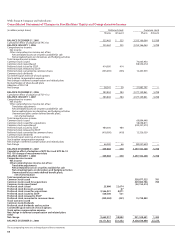
Wells Fargo & Company and Subsidiaries
Consolidated Statement of Changes in Stockholders’ Equity and Comprehensive Income
(in millions, except shares)
Preferred stock Common stock
Shares Amount Shares Amount
BALANCE DECEMBER 31, 2005 325,463 $ 325 3,355,166,064 $ 5,788
Cumulative effect of adoption of FAS 156
BALANCE JANUARY 1, 2006 325,463 325 3,355,166,064 5,788
Comprehensive income:
Net income
Other comprehensive income, net of tax:
Net unrealized losses on securities available for sale
Net unrealized gains on derivatives and hedging activities
Total comprehensive income
Common stock issued 70,063,930
Common stock repurchased (58,534,072)
Preferred stock issued to ESOP 414,000 414
Preferred stock released to ESOP
Preferred stock converted to common shares (355,659) (355) 10,453,939
Common stock dividends
Tax benefit upon exercise of stock options
Stock option compensation expense
Net change in deferred compensation and related plans
Reclassification of share-based plans
Adoption of FAS 158 __________ ________ _____________ ______
Net change 58,341 59 21,983,797 —
BALANCE DECEMBER 31, 2006 383,804 384 3,377,149,861 5,788
Cumulative effect of adoption of FSP 13-2
BALANCE JANUARY 1, 2007 383,804 384 3,377,149,861 5,788
Comprehensive income:
Net income
Other comprehensive income, net of tax:
Translation adjustments
Net unrealized losses on securities available for sale
Net unrealized gains on derivatives and hedging activities
Unamortized gains under defined benefit plans,
net of amortization
Total comprehensive income
Common stock issued 69,894,448
Common stock issued for acquisitions 58,058,813
Common stock repurchased (220,327,473)
Preferred stock issued to ESOP 484,000 484
Preferred stock released to ESOP
Preferred stock converted to common shares (418,000) (418) 12,326,559
Common stock dividends
Tax benefit upon exercise of stock options
Stock option compensation expense
Net change in deferred compensation and related plans __________ ________ _____________ ______
Net change 66,000 66 (80,047,653) —
BALANCE DECEMBER 31, 2007 449,804 450 3,297,102,208 5,788
Cumulative effect of adoption of EITF 06-4 and EITF 06-10
FAS 158 change of measurement date
BALANCE JANUARY 1, 2008 449,804 450 3,297,102,208 5,788
Comprehensive income:
Net income
Other comprehensive income, net of tax:
Translation adjustments
Net unrealized losses on securities available for sale
Net unrealized gains on derivatives and hedging activities
Unamortized losses under defined benefit plans,
net of amortization
Total comprehensive income
Common stock issued 538,877,525 781
Common stock issued for acquisitions 429,084,786 704
Common stock repurchased (52,154,513)
Preferred stock issued 25,000 22,674
Preferred stock discount accretion 67
Preferred stock issued for acquisitions 9,566,921 8,071
Preferred stock issued to ESOP 520,500 521
Preferred stock released to ESOP
Preferred stock converted to common shares (450,404) (451) 15,720,883
Stock warrants issued
Common stock dividends
Preferred stock dividends and accretion
Tax benefit upon exercise of stock options
Stock option compensation expense
Net change in deferred compensation and related plans
Other __________ ________ _____________ ______
Net change 9,662,017 30,882 931,528,681 1,485
BALANCE DECEMBER 31, 2008 10,111,821 $31,332 4,228,630,889 $7,273
The accompanying notes are an integral part of these statements.