Wells Fargo 2008 Annual Report Download - page 169
Download and view the complete annual report
Please find page 169 of the 2008 Wells Fargo annual report below. You can navigate through the pages in the report by either clicking on the pages listed below, or by using the keyword search tool below to find specific information within the annual report.-
 1
1 -
2
-
3
-
4
-
5
-
6
-
7
-
8
-
9
-
10
-
11
-
12
-
13
-
14
-
15
-
16
-
17
-
18
-
19
-
20
-
21
-
22
-
23
-
24
-
25
-
26
-
27
-
28
-
29
-
30
-
31
-
32
-
33
-
34
-
35
-
36
-
37
-
38
-
39
-
40
-
41
-
42
-
43
-
44
-
45
-
46
-
47
-
48
-
49
-
50
-
51
-
52
-
53
-
54
-
55
-
56
-
57
-
58
-
59
-
60
-
61
-
62
-
63
-
64
-
65
-
66
-
67
-
68
-
69
-
70
-
71
-
72
-
73
-
74
-
75
-
76
-
77
-
78
-
79
-
80
-
81
-
82
-
83
-
84
-
85
-
86
-
87
-
88
-
89
-
90
-
91
-
92
-
93
-
94
-
95
-
96
-
97
-
98
-
99
-
100
-
101
-
102
-
103
-
104
-
105
-
106
-
107
-
108
-
109
-
110
-
111
-
112
-
113
-
114
-
115
-
116
-
117
-
118
-
119
-
120
-
121
-
122
-
123
-
124
-
125
-
126
-
127
-
128
-
129
-
130
-
131
-
132
-
133
-
134
-
135
-
136
-
137
-
138
-
139
-
140
-
141
-
142
-
143
-
144
-
145
-
146
-
147
-
148
-
149
-
150
-
151
-
152
-
153
-
154
-
155
-
156
-
157
-
158
-
 159
159 -
 160
160 -
 161
161 -
 162
162 -
 163
163 -
 164
164 -
 165
165 -
 166
166 -
 167
167 -
 168
168 -
 169
169 -
 170
170 -
 171
171 -
 172
172
 |
 |

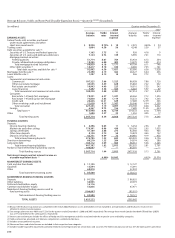
Stock Performance
These graphs compare the cumulative total stockholder
return and total compound annual growth rate (CAGR) for
our common stock (NYSE: WFC) for the five- and ten-year
periods ended December 31, 2008, with the cumulative
total stockholder returns for the same periods for the Keefe,
Bruyette and Woods 50 Total Return Index (the KBW 50
Bank Index) and the S&P 500 Index.
The cumulative total stockholder returns (including
reinvested dividends) in the graphs assume the investment
of $100 in Wells Fargo’s common stock, the KBW 50 Bank
Index and the S&P 500 Index.
$160
$140
$120
$100
$ 80
$ 60
$40
2003
$100
100
100
2004
$109
111
110
2005
$114
116
111
2006
$133
135
133
2007
$117
142
102
2008
$119
90
56
1998
$100
100
100
1999
$103
121
97
2000
$145
110
116
2001
$116
97
111
2002
$128
76
103
2003
$165
97
138
2004
$180
108
152
2005
$188
113
154
2006
$219
131
184
2007
$193
138
142
2008
$197
87
77
5-year
CAGR
4% Wells Fargo
-2% S&P 500
-11% KBW 50
FIVE YEARS
10-year
CAGR
7% Wells Fargo
-1% S&P 500
-3% KBW 50
Wells Fargo
(WFC)
S&P 500
KBW 50
$220
$200
$180
$160
$140
$120
$100
$80
$60
TEN YEARS
Wells Fargo
(WFC)
S&P 500
KBW 50