Wells Fargo 2008 Annual Report Download - page 142
Download and view the complete annual report
Please find page 142 of the 2008 Wells Fargo annual report below. You can navigate through the pages in the report by either clicking on the pages listed below, or by using the keyword search tool below to find specific information within the annual report.-
 1
1 -
2
-
3
-
4
-
5
-
6
-
7
-
8
-
9
-
10
-
11
-
12
-
13
-
14
-
15
-
16
-
17
-
18
-
19
-
20
-
21
-
22
-
23
-
24
-
25
-
26
-
27
-
28
-
29
-
30
-
31
-
32
-
33
-
34
-
35
-
36
-
37
-
38
-
39
-
40
-
41
-
42
-
43
-
44
-
45
-
46
-
47
-
48
-
49
-
50
-
51
-
52
-
53
-
54
-
55
-
56
-
57
-
58
-
59
-
60
-
61
-
62
-
63
-
64
-
65
-
66
-
67
-
68
-
69
-
70
-
71
-
72
-
73
-
74
-
75
-
76
-
77
-
78
-
79
-
80
-
81
-
82
-
83
-
84
-
85
-
86
-
87
-
88
-
89
-
90
-
91
-
92
-
93
-
94
-
95
-
96
-
97
-
98
-
99
-
100
-
101
-
102
-
103
-
104
-
105
-
106
-
107
-
108
-
109
-
110
-
111
-
112
-
113
-
114
-
115
-
116
-
117
-
118
-
119
-
120
-
121
-
122
-
123
-
124
-
125
-
126
-
127
-
128
-
129
-
130
-
131
-
 132
132 -
 133
133 -
 134
134 -
 135
135 -
 136
136 -
 137
137 -
 138
138 -
 139
139 -
 140
140 -
 141
141 -
 142
142 -
 143
143 -
 144
144 -
 145
145 -
 146
146 -
 147
147 -
 148
148 -
 149
149 -
 150
150 -
 151
151 -
 152
152 -
153
-
154
-
155
-
156
-
157
-
158
-
159
-
160
-
161
-
162
-
163
-
164
-
165
-
166
-
167
-
168
-
169
-
170
-
171
-
172
 |
 |

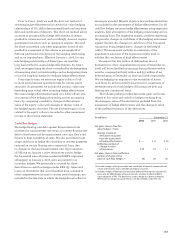
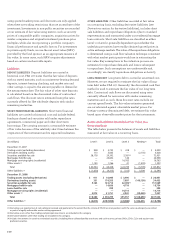
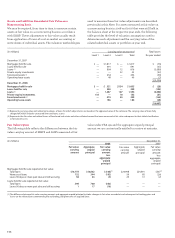
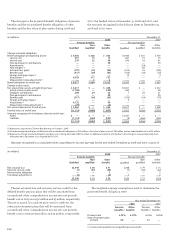
(in millions) Level 1 Level 2 Level 3 Netting(1) Total
December 31, 2007
Trading assets (excluding derivatives) $ 928 $ 2,753 $ 418 $ — $ 4,099
Derivatives (trading assets) 113 5,665 — (2,150) 3,628
Securities available for sale 38,178 29,392 5,381(4) — 72,951
Mortgages held for sale — 24,852 146 — 24,998
Mortgage servicing rights (residential) — — 16,763 — 16,763
Other assets (2) 1,145 1,766 41 (1,559) 1,393
Total $ 40,364 $ 64,428 $ 22,749 $ (3,709) $ 123,832
Other liabilities (3) $ (1,670) $ (4,315) $ (315) $ 3,709 $ (2,591)
December 31, 2008
Trading assets (excluding derivatives) $ 911 $ 16,045 $ 3,495 $ — $ 20,451
Derivatives (trading assets) 331 174,355 7,897 (148,150) 34,433
Securities available for sale 5,163 123,714 22,692(4) — 151,569
Mortgages held for sale — 14,036 4,718 — 18,754
Loans held for sale — 398 — — 398
Mortgage servicing rights (residential) — — 14,714 — 14,714
Other assets (2) 3,975 21,751 2,041 (20,540) 7,227
Total $10,380 $ 350,299 $55,557 $(168,690) $247,546
Other liabilities (3) $ (4,815) $(187,098) $ (9,308) $ 182,435 $ (18,786)
(1) Derivatives are reported net of cash collateral received and paid and, to the extent that the criteria of FIN 39 are met, positions with the same counterparty are netted
as part of a legally enforceable master netting agreement.
(2) Derivative assets other than trading and principal investments are included in this category.
(3) Derivative liabilities other than trading are included in this category.
(4) Includes investments in certain asset-backed securities, including those collateralized by auto leases and cash reserves, private CMOs, CDOs, CLOs and auction-rate
preferred securities.
using quoted market prices and discounts are only applied
when there are trading restrictions that are an attribute of the
investment. Investments in non-public securities are recorded
at our estimate of fair value using metrics such as security
prices of comparable public companies, acquisition prices for
similar companies and original investment purchase price
multiples, while also incorporating a portfolio company’s
financial performance and specific factors. For investments
in private equity funds, we use the net asset value (NAV)
provided by the fund sponsor as an appropriate measure of
fair value. In some cases, such NAVs require adjustments
based on certain unobservable inputs.
Liabilities
DEPOSIT LIABILITIES Deposit liabilities are carried at
historical cost. FAS 107 states that the fair value of deposits
with no stated maturity, such as noninterest-bearing demand
deposits, interest-bearing checking, and market rate and
other savings, is equal to the amount payable on demand at
the measurement date. The fair value of other time deposits
is calculated based on the discounted value of contractual
cash flows. The discount rate is estimated using the rates
currently offered for like wholesale deposits with similar
remaining maturities.
SHORT-TERM FINANCIAL LIABILITIES Short-term financial
liabilities are carried at historical cost and include federal
funds purchased and securities sold under repurchase
agreements, commercial paper and other short-term
borrowings. The carrying amount is a reasonable estimate
of fair value because of the relatively short time between the
origination of the instrument and its expected realization.
OTHER LIABILITIES Other liabilities recorded at fair value
on a recurring basis, excluding derivative liabilities (see
Derivatives section for derivative liabilities), includes short
sale liabilities and repurchase obligations (due to standard
representations and warranties) under our residential mortgage
loan contracts. Short sale liabilities are classified as either
Level 1 or Level 2, generally dependent upon whether the
underlying securities have readily obtained quoted prices in
active exchange markets. The value of the repurchase obligations
is determined using a cash flow valuation technique consistent
with what market participants would use in estimating the
fair value. Key assumptions in the valuation process are
estimates for repurchase demands and losses subsequent
to repurchase. Such assumptions are unobservable and,
accordingly, we classify repurchase obligations as Level 3.
LONG-TERM DEBT Long-term debt is carried at amortized cost.
However, we are required to estimate the fair value of long-
term debt under FAS 107. Generally, the discounted cash flow
method is used to estimate the fair value of our long-term
debt. Contractual cash flows are discounted using rates
currently offered for new notes with similar remaining
maturities and, as such, these discount rates include our
current spread levels. The fair value estimates generated
are corroborated against observable market prices. For
foreign-currency denominated debt, we estimate fair value
based upon observable market prices for the instruments.
Assets and Liabilities Recorded at Fair Value on a
Recurring Basis
The table below presents the balances of assets and liabilities
measured at fair value on a recurring basis.