Wells Fargo 2008 Annual Report Download - page 155
Download and view the complete annual report
Please find page 155 of the 2008 Wells Fargo annual report below. You can navigate through the pages in the report by either clicking on the pages listed below, or by using the keyword search tool below to find specific information within the annual report.-
 1
1 -
2
-
3
-
4
-
5
-
6
-
7
-
8
-
9
-
10
-
11
-
12
-
13
-
14
-
15
-
16
-
17
-
18
-
19
-
20
-
21
-
22
-
23
-
24
-
25
-
26
-
27
-
28
-
29
-
30
-
31
-
32
-
33
-
34
-
35
-
36
-
37
-
38
-
39
-
40
-
41
-
42
-
43
-
44
-
45
-
46
-
47
-
48
-
49
-
50
-
51
-
52
-
53
-
54
-
55
-
56
-
57
-
58
-
59
-
60
-
61
-
62
-
63
-
64
-
65
-
66
-
67
-
68
-
69
-
70
-
71
-
72
-
73
-
74
-
75
-
76
-
77
-
78
-
79
-
80
-
81
-
82
-
83
-
84
-
85
-
86
-
87
-
88
-
89
-
90
-
91
-
92
-
93
-
94
-
95
-
96
-
97
-
98
-
99
-
100
-
101
-
102
-
103
-
104
-
105
-
106
-
107
-
108
-
109
-
110
-
111
-
112
-
113
-
114
-
115
-
116
-
117
-
118
-
119
-
120
-
121
-
122
-
123
-
124
-
125
-
126
-
127
-
128
-
129
-
130
-
131
-
132
-
133
-
134
-
135
-
136
-
137
-
138
-
139
-
140
-
141
-
142
-
143
-
144
-
 145
145 -
 146
146 -
 147
147 -
 148
148 -
 149
149 -
 150
150 -
 151
151 -
 152
152 -
 153
153 -
 154
154 -
 155
155 -
 156
156 -
 157
157 -
 158
158 -
 159
159 -
 160
160 -
 161
161 -
 162
162 -
 163
163 -
 164
164 -
 165
165 -
166
-
167
-
168
-
169
-
170
-
171
-
172
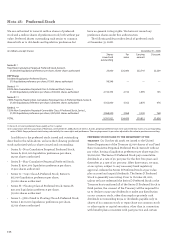
 |
 |

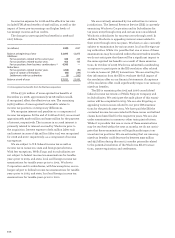
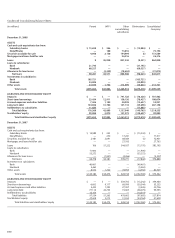
(in millions) December 31,
2008 2007
Deferred tax assets
Allowance for loan losses $ 7,859 $ 1,977
Deferred compensation
and employee benefits 2,016 576
Accrued expenses,
deductible when paid 1,536 451
SOP 03-3 loans 13,806 —
Mark to market, net 194 —
Net unrealized losses on
securities available for sale 3,887 —
Net operating loss and tax
credit carry forwards 520 —
Other 1,421 1,358
Total deferred tax assets 31,239 4,362
Deferred tax assets valuation allowance (973) —
Deferred tax liabilities
Mortgage servicing rights (5,606) (5,103)
Leasing (2,617) (1,737)
Basis difference in investments (325) —
Mark to market, net —(427)
Intangible assets (5,625) (360)
Net unrealized gains on
securities available for sale —(242)
Other (2,229) (1,150)
Total deferred tax liabilities (16,402) (9,019)
Net deferred tax asset (liability) $ 13,864 $(4,657)
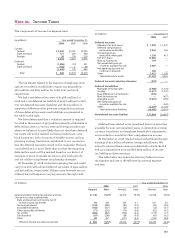
The components of income tax expense were:
The tax benefit related to the exercise of employee stock
options recorded in stockholders’ equity was $123 million,
$210 million and $229 million for 2008, 2007 and 2006,
respectively.
We had a net deferred tax asset of $13,864 million for
2008 and a net deferred tax liability of $4,657 million for 2007.
Our net deferred tax asset (liability) and the tax effects of
temporary differences that gave rise to significant portions
of these deferred tax assets and liabilities are presented in
the table on the right.
We have determined that a valuation reserve is required
for 2008 in the amount of $973 million primarily attributable to
deferred tax assets in various state and foreign jurisdictions
where we believe it is more likely than not that these deferred
tax assets will not be realized. In these jurisdictions, carry
back limitations, lack of sources of taxable income, and tax
planning strategy limitations contributed to our conclusion
that the deferred tax assets would not be realizable. We have
concluded that it is more likely than not that the remaining
deferred tax assets will be realized based on our history of
earnings, sources of taxable income in carry back periods,
and our ability to implement tax planning strategies.
At December 31, 2008, we had net operating loss and credit
carry forwards with related deferred tax assets of $424 million
and $96 million, respectively. If these carry forwards are not
utilized, they will expire in varying amounts through 2028.
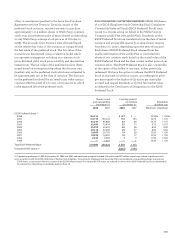
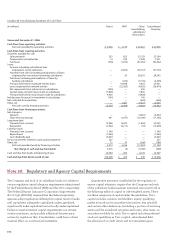
Note 21: Income Taxes
(in millions) Year ended December 31,
2008 2007 2006
Current:
Federal $ 2,043 $3,181 $2,993
State and local 171 284 438
Foreign 30 136 239
2,244 3,601 3,670
Deferred:
Federal (1,506) (32) 491
State and local (136) 1 69
(1,642) (31) 560
Total $ 602 $3,570 $4,230
Deferred taxes related to net unrealized losses on securities
available for sale, net unrealized gains on derivatives, foreign
currency translation, and employee benefit plan adjustments
are recorded in cumulative other comprehensive income.
At December 31, 2008, Wachovia had undistributed foreign
earnings of $2.2 billion related to foreign subsidiaries. We
intend to reinvest these earnings indefinitely outside the U.S.
and accordingly have not provided $669 million of income
tax liability on these earnings.
The table below reconciles the statutory federal income
tax expense and rate to the effective income tax expense
and rate.
(in millions) Year ended December 31,
2008 2007 2006
Amount Rate Amount Rate Amount Rate
Statutory federal income tax expense and rate $1,140 35.0% $4,070 35.0% $4,428 35.0%
Change in tax rate resulting from:
State and local taxes on income, net of
federal income tax benefit 94 2.9 359 3.1 331 2.6
Tax-exempt interest (130) (4.0) (81) (0.7) (76) (0.6)
Excludable dividends (186) (5.7) (23) (0.2) (12) (0.1)
Other deductible dividends (71) (2.2) (70) (0.6) (63) (0.5)
Tax credits (266) (8.2) (256) (2.2) (215) (1.7)
Life insurance (67) (2.0) (58) (0.5) (63) (0.5)
Other 88 2.7 (371) (3.2) (100) (0.8)
Effective income tax expense and rate $ 602 18.5% $3,570 30.7% $4,230 33.4%