Wells Fargo 2008 Annual Report Download - page 52
Download and view the complete annual report
Please find page 52 of the 2008 Wells Fargo annual report below. You can navigate through the pages in the report by either clicking on the pages listed below, or by using the keyword search tool below to find specific information within the annual report.-
 1
1 -
2
-
3
-
4
-
5
-
6
-
7
-
8
-
9
-
10
-
11
-
12
-
13
-
14
-
15
-
16
-
17
-
18
-
19
-
20
-
21
-
22
-
23
-
24
-
25
-
26
-
27
-
28
-
29
-
30
-
31
-
32
-
33
-
34
-
35
-
36
-
37
-
38
-
39
-
40
-
41
-
 42
42 -
 43
43 -
 44
44 -
 45
45 -
 46
46 -
 47
47 -
 48
48 -
 49
49 -
 50
50 -
 51
51 -
 52
52 -
 53
53 -
 54
54 -
 55
55 -
 56
56 -
 57
57 -
 58
58 -
 59
59 -
 60
60 -
 61
61 -
 62
62 -
63
-
64
-
65
-
66
-
67
-
68
-
69
-
70
-
71
-
72
-
73
-
74
-
75
-
76
-
77
-
78
-
79
-
80
-
81
-
82
-
83
-
84
-
85
-
86
-
87
-
88
-
89
-
90
-
91
-
92
-
93
-
94
-
95
-
96
-
97
-
98
-
99
-
100
-
101
-
102
-
103
-
104
-
105
-
106
-
107
-
108
-
109
-
110
-
111
-
112
-
113
-
114
-
115
-
116
-
117
-
118
-
119
-
120
-
121
-
122
-
123
-
124
-
125
-
126
-
127
-
128
-
129
-
130
-
131
-
132
-
133
-
134
-
135
-
136
-
137
-
138
-
139
-
140
-
141
-
142
-
143
-
144
-
145
-
146
-
147
-
148
-
149
-
150
-
151
-
152
-
153
-
154
-
155
-
156
-
157
-
158
-
159
-
160
-
161
-
162
-
163
-
164
-
165
-
166
-
167
-
168
-
169
-
170
-
171
-
172
 |
 |

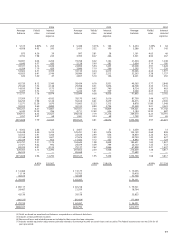
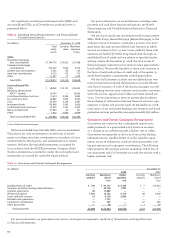
Table 4: Analysis of Changes in Net Interest Income
(in millions) Year ended December 31,
2008 over 2007 2007 over 2006
Volume Rate Total Volume Rate Total
Increase (decrease) in interest income:
Federal funds sold, securities purchased under resale
agreements and other short-term investments $ 35 $ (168) $ (133) $ (52) $ 10 $ (42)
Trading assets 26 (25) 1 (30) (27) (57)
Debt securities available for sale:
Securities of U.S. Treasury and federal agencies 9(4)5 (2) (1) (3)
Securities of U.S. states and political subdivisions 181 (22) 159 117 (20) 97
Mortgage-backed securities:
Federal agencies 349 (54) 295 102 20 122
Private collateralized mortgage obligations 1,017 (4) 1,013 (5) (26) (31)
Other debt securities 543 (20) 523 83038
Mortgages held for sale (460) (117) (577) (634) 38 (596)
Loans held for sale (4) (18) (22) 21 2 23
Loans:
Commercial and commercial real estate:
Commercial 1,471 (1,804) (333) 1,001 26 1,027
Other real estate mortgage 581 (579) 2 248 18 266
Real estate construction 176 (509) (333) 167 (21) 146
Lease financing 69 (14) 55 28 7 35
Consumer:
Real estate 1-4 family first mortgage 924 (379) 545 292 (11) 281
Real estate 1-4 family junior lien mortgage 258 (1,175) (917) 634 91 725
Credit card 470 (247) 223 448 37 485
Other revolving credit and installment (7) (534) (541) 339 57 396
Foreign (22) (85) (107) 116 (47) 69
Other 25 (5) 20 2 1 3
Total increase (decrease) in interest income 5,641 (5,763) (122) 2,800 184 2,984
Increase (decrease) in interest expense:
Deposits:
Interest-bearing checking 17 (113) (96) 23 14 37
Market rate and other savings 469 (2,379) (1,910) 345 535 880
Savings certificates (43) (515) (558) 343 164 507
Other time deposits (94) (154) (248) (1,134) (38) (1,172)
Deposits in foreign offices 396 (1,215) (819) 732 (6) 726
Short-term borrowings 1,158 (925) 233 211 42 253
Long-term debt 439 (1,474) (1,035) 465 235 700
Total increase (decrease) in interest expense 2,342 (6,775) (4,433) 985 946 1,931
Increase (decrease) in net interest income
on a taxable-equivalent basis $3,299 $ 1,012 $ 4,311 $ 1,815 $(762) $ 1,053
Table 4 allocates the changes in net interest income on a
taxable-equivalent basis to changes in either average bal-
ances or average rates for both interest-earning assets and
interest-bearing liabilities. Because of the numerous simulta-
neous volume and rate changes during any period, it is not
possible to precisely allocate such changes between volume
and rate. For this table, changes that are not solely due to
either volume or rate are allocated to these categories in pro-
portion to the percentage changes in average volume and
average rate.
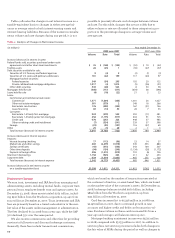
Noninterest Income
We earn trust, investment and IRA fees from managing and
administering assets, including mutual funds, corporate trust,
personal trust, employee benefit trust and agency assets. At
December 31, 2008, these assets totaled $1.62 trillion, includ-
ing $510 billion from the Wachovia acquisition, up 45% from
$1.12 trillion at December 31, 2007. Trust, investment and IRA
fees are primarily based on a tiered scale relative to the mar-
ket value of the assets under management or administration.
The fees declined 6% in 2008 from a year ago, while the S&P
500 declined 35% over the same period.
We also receive commissions and other fees for providing
services to full-service and discount brokerage customers.
Generally, these fees include transactional commissions,
which are based on the number of transactions executed at
the customer’s direction, or asset-based fees, which are based
on the market value of the customer’s assets. At December 31,
2008, brokerage balances totaled $970 billion, including
$859 billion from the Wachovia acquisition, up from
$131 billion at December 31, 2007.
Card fees increased 9% to $2,336 million in 2008 from
$2,136 million in 2007, due to continued growth in new
accounts and higher credit and debit card transaction vol-
ume. Purchase volume on these cards increased 8% from a
year ago and average card balances were up 25%.
Mortgage banking noninterest income was $2,525 million
in 2008, compared with $3,133 million in 2007. In addition to
servicing fees, net servicing income includes both changes in
the fair value of MSRs during the period as well as changes in