Wells Fargo 2008 Annual Report Download - page 40
Download and view the complete annual report
Please find page 40 of the 2008 Wells Fargo annual report below. You can navigate through the pages in the report by either clicking on the pages listed below, or by using the keyword search tool below to find specific information within the annual report.-
 1
1 -
2
-
3
-
4
-
5
-
6
-
7
-
8
-
9
-
10
-
11
-
12
-
13
-
14
-
15
-
16
-
17
-
18
-
19
-
20
-
21
-
22
-
23
-
24
-
25
-
26
-
27
-
28
-
29
-
 30
30 -
 31
31 -
 32
32 -
 33
33 -
 34
34 -
 35
35 -
 36
36 -
 37
37 -
 38
38 -
 39
39 -
 40
40 -
 41
41 -
 42
42 -
 43
43 -
 44
44 -
 45
45 -
 46
46 -
 47
47 -
 48
48 -
 49
49 -
 50
50 -
51
-
52
-
53
-
54
-
55
-
56
-
57
-
58
-
59
-
60
-
61
-
62
-
63
-
64
-
65
-
66
-
67
-
68
-
69
-
70
-
71
-
72
-
73
-
74
-
75
-
76
-
77
-
78
-
79
-
80
-
81
-
82
-
83
-
84
-
85
-
86
-
87
-
88
-
89
-
90
-
91
-
92
-
93
-
94
-
95
-
96
-
97
-
98
-
99
-
100
-
101
-
102
-
103
-
104
-
105
-
106
-
107
-
108
-
109
-
110
-
111
-
112
-
113
-
114
-
115
-
116
-
117
-
118
-
119
-
120
-
121
-
122
-
123
-
124
-
125
-
126
-
127
-
128
-
129
-
130
-
131
-
132
-
133
-
134
-
135
-
136
-
137
-
138
-
139
-
140
-
141
-
142
-
143
-
144
-
145
-
146
-
147
-
148
-
149
-
150
-
151
-
152
-
153
-
154
-
155
-
156
-
157
-
158
-
159
-
160
-
161
-
162
-
163
-
164
-
165
-
166
-
167
-
168
-
169
-
170
-
171
-
172
 |
 |

Auto portfolio net charge-offs for 2008 were $1.23 billion
(4.50% of average auto loans), compared with $1.02 billion
(3.45%) in 2007. While we have continued to reduce the size
of this portfolio and limited additional growth, the economic
environment has adversely affected portfolio results. We
have remained focused on our loss mitigation strategies,
however, credit performance has deteriorated as a result of
increased unemployment and depressed used car values,
resulting in higher than expected losses for the year.
The provision for credit losses was $15.98 billion in 2008,
an increase of $11.04 billion from $4.94 billion in 2007, due to
higher net charge-offs and the 2008 credit reserve build of
$8.14 billion, including $3.9 billion to conform estimated loss
emergence coverage periods to the most conservative of each
company within FFIEC guidelines ($2.7 billion for Wells Fargo
consumer loans and $1.2 billion for Wachovia commercial
and Pick-a-Pay loans). The balance of the reserve build was
attributed to higher projected loss rates across the majority
of the consumer credit business, and some credit deterioration
and growth in the wholesale portfolios. The allowance for credit
losses, which consists of the allowance for loan losses and the
reserve for unfunded credit commitments, was $21.7 billion
(2.51% of total loans) at December 31, 2008, compared with
$5.52 billion (1.44%) at December 31, 2007.
At December 31, 2008, total nonaccrual loans were
$6.80 billion (0.79% of total loans) up from $2.68 billion
(0.70%) at December 31, 2007. Total nonaccrual loans at
December 31, 2008, excluded $20.0 billion of SOP 03-3 loans
that were previously reflected as nonaccrual by Wachovia.
The majority of the $4.1 billion increase in nonaccrual loans
was in the real estate 1-4 family first mortgage portfolio,
including $742 million in Wells Fargo Financial real estate
and $424 million in Wells Fargo Home Mortgage, and was due
to the national rise in mortgage default rates. Total nonper-
forming assets (NPAs) were $9.01 billion (1.04% of total loans)
at December 31, 2008, compared with $3.87 billion (1.01%) at
December 31, 2007. Total NPAs at December 31, 2008, excluded
$20.0 billion of SOP 03-3 loans that were previously reflected
as nonperforming by Wachovia. Foreclosed assets were
$2.19 billion at December 31, 2008, including $885 million
from Wachovia, compared with $1.18 billion at December 31,
2007. Foreclosed assets, a component of total NPAs, included
$1.53 billion and $649 million in residential property and auto
loans and $667 million and $535 million of foreclosed real
estate securing Government National Mortgage Association
(GNMA) loans at December 31, 2008 and 2007, respectively,
consistent with regulatory reporting requirements. The fore-
closed real estate securing GNMA loans of $667 million rep-
resented eight basis points of the ratio of NPAs to loans at
December 31, 2008. Both principal and interest for the GNMA
loans secured by the foreclosed real estate are collectible
because the GNMA loans are insured by the Federal Housing
Administration (FHA) or guaranteed by the Department of
Veterans Affairs.
The Company and each of its subsidiary banks remained
“well capitalized” under applicable regulatory capital adequacy
guidelines. The ratio of common stockholders’ equity to total
assets was 5.21% at December 31, 2008, compared with 8.28%
at December 31, 2007. Our total risk-based capital (RBC) ratio
at December 31, 2008, was 11.83% and our Tier 1 RBC ratio was
7.84%, exceeding the minimum regulatory guidelines of 8% and
4%, respectively, for bank holding companies. Our RBC ratios
at December 31, 2007, were 10.68% and 7.59%, respectively. Our
Tier 1 leverage ratios were 14.52% and 6.83% at December 31,
2008 and 2007, respectively, exceeding the minimum regula-
tory guideline of 3% for bank holding companies.
Current Accounting Developments
On January 1, 2008, we adopted the following new account-
ing pronouncements:
• FSP FIN 39-1 – Financial Accounting Standards Board
(FASB) Staff Position on Interpretation No. 39,
Amendment of FASB Interpretation No. 39;
• EITF 06-4 – Emerging Issues Task Force (EITF) Issue
No. 06-4, Accounting for Deferred Compensation and
Postretirement Benefit Aspects of Endorsement Split-Dollar
Life Insurance Arrangements;
• EITF 06-10 – EITF Issue No. 06-10, Accounting for
Collateral Assignment Split-Dollar Life Insurance
Arrangements; and
• SAB 109 – Staff Accounting Bulletin No. 109, Written Loan
Commitments Recorded at Fair Value Through Earnings.
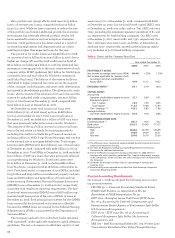
Table 2: Ratios and Per Common Share Data
Year ended December 31,
2008 2007 2006
PROFITABILITY RATIOS
Net income to average total assets (ROA) 0.44% 1.55% 1.73%
Net income applicable to common stock
to average common stockholders’
equity (ROE) 4.79 17.12 19.52
EFFICIENCY RATIO (1) 54.1 57.9 58.4
CAPITAL RATIOS
At year end:
Common stockholders’ equity to assets 5.21 8.28 9.51
Risk-based capital (2)
Tier 1 capital 7.84 7.59 8.93
Total capital 11.83 10.68 12.49
Tier 1 leverage (2)(3) 14.52 6.83 7.88
Average balances:
Common stockholders’ equity to assets 8.18 9.04 8.88
PER COMMON SHARE DATA
Dividend payout (4) 185.7 49.0 43.2
Book value $16.15 $14.45 $13.57
Market price (5)
High $44.68 $37.99 $36.99
Low 19.89 29.29 30.31
Year end 29.48 30.19 35.56
(1) The efficiency ratio is noninterest expense divided by total revenue (net interest
income and noninterest income).
(2) See Note 26 (Regulatory and Agency Capital Requirements) to Financial
Statements for additional information.
(3) Due to the Wachovia acquisition closing on December 31, 2008, the Tier 1
leverage ratio, which considers period-end Tier 1 capital and quarterly averages
in the computation of the ratio, does not reflect average assets of Wachovia for
the full period.
(4) Dividends declared per common share as a percentage of earnings per
common share.
(5) Based on daily prices reported on the New York Stock Exchange Composite
Transaction Reporting System.