Wells Fargo 2008 Annual Report Download - page 120
Download and view the complete annual report
Please find page 120 of the 2008 Wells Fargo annual report below. You can navigate through the pages in the report by either clicking on the pages listed below, or by using the keyword search tool below to find specific information within the annual report.-
 1
1 -
2
-
3
-
4
-
5
-
6
-
7
-
8
-
9
-
10
-
11
-
12
-
13
-
14
-
15
-
16
-
17
-
18
-
19
-
20
-
21
-
22
-
23
-
24
-
25
-
26
-
27
-
28
-
29
-
30
-
31
-
32
-
33
-
34
-
35
-
36
-
37
-
38
-
39
-
40
-
41
-
42
-
43
-
44
-
45
-
46
-
47
-
48
-
49
-
50
-
51
-
52
-
53
-
54
-
55
-
56
-
57
-
58
-
59
-
60
-
61
-
62
-
63
-
64
-
65
-
66
-
67
-
68
-
69
-
70
-
71
-
72
-
73
-
74
-
75
-
76
-
77
-
78
-
79
-
80
-
81
-
82
-
83
-
84
-
85
-
86
-
87
-
88
-
89
-
90
-
91
-
92
-
93
-
94
-
95
-
96
-
97
-
98
-
99
-
100
-
101
-
102
-
103
-
104
-
105
-
106
-
107
-
108
-
109
-
 110
110 -
 111
111 -
 112
112 -
 113
113 -
 114
114 -
 115
115 -
 116
116 -
 117
117 -
 118
118 -
 119
119 -
 120
120 -
 121
121 -
 122
122 -
 123
123 -
 124
124 -
 125
125 -
 126
126 -
 127
127 -
 128
128 -
 129
129 -
 130
130 -
131
-
132
-
133
-
134
-
135
-
136
-
137
-
138
-
139
-
140
-
141
-
142
-
143
-
144
-
145
-
146
-
147
-
148
-
149
-
150
-
151
-
152
-
153
-
154
-
155
-
156
-
157
-
158
-
159
-
160
-
161
-
162
-
163
-
164
-
165
-
166
-
167
-
168
-
169
-
170
-
171
-
172
 |
 |

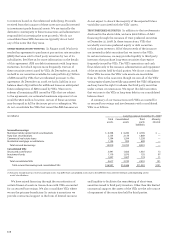
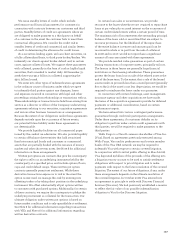
(in millions) Carrying value at December 31, 2008(1)
Total Consolidated Third Minority
assets assets party interest
liabilities
Secured borrowings:
Municipal tender option bond securitizations $ 6,358 $ 6,280 $ 4,765 $ —
Auto loan securitizations 2,134 2,134 1,869 —
Commercial real estate loans 1,294 1,294 1,258 —
Residential mortgage securitizations 1,124 995 699 —
Total secured borrowings 10,910 10,703 8,591 —
Consolidated VIEs:
Structured asset finance 3,491 1,666 1,481 13
Investment funds 1,119 1,070 155 97
Other 1,007 1,007 774 11
Total consolidated VIEs 5,617 3,743 2,410 121
Total secured borrowings and consolidated VIEs $16,527 $14,446 $11,001 $121
(1) Amounts exclude loan loss reserves, and total assets may differ from consolidated assets due to the different measurement methods used depending on the
assets’ classifications.
We have raised financing through the securitization of
certain financial assets in transactions with VIEs accounted
for as secured borrowings. We also consolidate VIEs where
we are the primary beneficiary. In certain transactions we
provide contractual support in the form of limited recourse
and liquidity to facilitate the remarketing of short-term
securities issued to third party investors. Other than this limited
contractual support, the assets of the VIEs are the sole source
of repayment of the securities held by third parties.
to investors based on the referenced underlying. Proceeds
received from the issuance of these notes are usually invested
in investment grade financial assets. We are typically the
derivative counterparty to these transactions and administrator
responsible for investing the note proceeds. We do not
consolidate these SPEs because we typically do not hold
any of the notes that they issue.
OTHER TRANSACTIONS WITH VIEs In August 2008, Wachovia
reached an agreement to purchase at par auction rate securities
(ARS) that were sold to third party investors by two of its
subsidiaries. See Note 15 for more information on the details
of this agreement. ARS are debt instruments with long-term
maturities, but which reprice more frequently. Certain of
these securities were issued by VIEs. At December 31, 2008,
we held in our securities available-for-sale portfolio $3.7 billion
of ARS issued by VIEs that we redeemed pursuant to this
agreement. At December 31, 2008, we had a liability in our
balance sheet of $91 million for additional losses on anticipated
future redemptions of ARS issued by VIEs. Were we to
redeem all remaining ARS issued by VIEs that are subject
to the agreement, our estimated maximum exposure to loss
would be $620 million; however, certain of these securities
may be repaid in full by the issuer prior to redemption. We
do not consolidate the VIEs that issued the ARS because we
do not expect to absorb the majority of the expected future
variability associated with the VIEs’ assets.
TRUST PREFERRED SECURITIES In addition to the involvements
disclosed in the above table, we have $16.6 billion of debt
financing through the issuance of trust preferred securities
at December 31, 2008. In these transactions, VIEs that
we wholly own issue preferred equity or debt securities
to third party investors. All of the proceeds of the issuance
are invested in debt securities that we issue to the VIEs.
In certain instances, we may provide liquidity to third party
investors that purchase long-term securities that reprice
frequently issued by VIEs. The VIE’s operations and cash
flows relate only to the issuance, administration and repayment
of the securities held by third parties. We do not consolidate
these VIEs because the VIEs’ sole assets are receivables
from us. This is the case even though we own all of the VIEs’
voting equity shares, have fully guaranteed the VIEs’ obligations
and may have the right to redeem the third party securities
under certain circumstances. We report the debt securities
that we issue to the VIEs as long-term debt in our consolidated
balance sheet.
A summary of our transactions with VIEs accounted for
as secured borrowings and involvements with consolidated
VIEs is as follows: