Wells Fargo 2008 Annual Report Download - page 144
Download and view the complete annual report
Please find page 144 of the 2008 Wells Fargo annual report below. You can navigate through the pages in the report by either clicking on the pages listed below, or by using the keyword search tool below to find specific information within the annual report.-
 1
1 -
2
-
3
-
4
-
5
-
6
-
7
-
8
-
9
-
10
-
11
-
12
-
13
-
14
-
15
-
16
-
17
-
18
-
19
-
20
-
21
-
22
-
23
-
24
-
25
-
26
-
27
-
28
-
29
-
30
-
31
-
32
-
33
-
34
-
35
-
36
-
37
-
38
-
39
-
40
-
41
-
42
-
43
-
44
-
45
-
46
-
47
-
48
-
49
-
50
-
51
-
52
-
53
-
54
-
55
-
56
-
57
-
58
-
59
-
60
-
61
-
62
-
63
-
64
-
65
-
66
-
67
-
68
-
69
-
70
-
71
-
72
-
73
-
74
-
75
-
76
-
77
-
78
-
79
-
80
-
81
-
82
-
83
-
84
-
85
-
86
-
87
-
88
-
89
-
90
-
91
-
92
-
93
-
94
-
95
-
96
-
97
-
98
-
99
-
100
-
101
-
102
-
103
-
104
-
105
-
106
-
107
-
108
-
109
-
110
-
111
-
112
-
113
-
114
-
115
-
116
-
117
-
118
-
119
-
120
-
121
-
122
-
123
-
124
-
125
-
126
-
127
-
128
-
129
-
130
-
131
-
132
-
133
-
 134
134 -
 135
135 -
 136
136 -
 137
137 -
 138
138 -
 139
139 -
 140
140 -
 141
141 -
 142
142 -
 143
143 -
 144
144 -
 145
145 -
 146
146 -
 147
147 -
 148
148 -
 149
149 -
 150
150 -
 151
151 -
 152
152 -
 153
153 -
 154
154 -
155
-
156
-
157
-
158
-
159
-
160
-
161
-
162
-
163
-
164
-
165
-
166
-
167
-
168
-
169
-
170
-
171
-
172
 |
 |

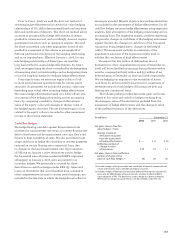
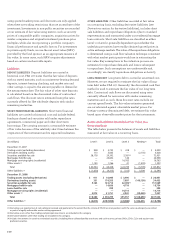
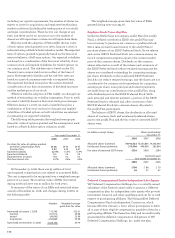
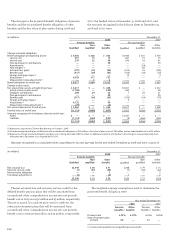
Fair Value Option
The following table reflects the differences between the fair
value carrying amount of MHFS and LHFS measured at fair
value under FAS 159 and the aggregate unpaid principal
amount we are contractually entitled to receive at maturity.
(in millions) December 31,
2008 2007
Fair value Aggregate Fair value Fair value Aggregate Fair value
carrying unpaid carrying carrying unpaid carrying
amount principal amount amount principal amount
less less
aggregate aggregate
unpaid unpaid
principal principal
Mortgages held for sale reported at fair value:
Total loans $18,754 $18,862 $(108)(1) $24,998 $24,691 $307(1)
Nonaccrual loans 152 344 (192) 59 85 (26)
Loans 90 days or more past due and still accruing 58 63 (5) 29 31 (2)
Loans held for sale reported at fair value:
Total loans 398 760 (362) ———
Loans 90 days or more past due and still accruing 1 17 (16) ———
(1) The difference between fair value carrying amount and aggregate unpaid principal includes changes in fair value recorded at and subsequent to funding, gains and
losses on the related loan commitment prior to funding, and premiums on acquired loans.
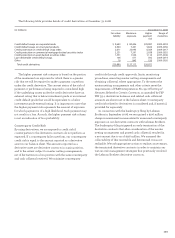
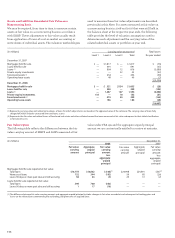
Assets and Liabilities Recorded at Fair Value on a
Nonrecurring Basis
We may be required, from time to time, to measure certain
assets at fair value on a nonrecurring basis in accordance
with GAAP. These adjustments to fair value usually result
from application of lower-of-cost-or-market accounting or
write-downs of individual assets. The valuation methodologies
used to measure these fair value adjustments are described
previously in this Note. For assets measured at fair value on
a nonrecurring basis in 2008 and 2007 that were still held in
the balance sheet at the respective year ends, the following
table provides the level of valuation assumptions used to
determine each adjustment and the carrying value of the
related individual assets or portfolios at year end.
(in millions) Carrying value at year end Total losses
Level 1 Level 2 Level 3 Total for year ended
December 31, 2007
Mortgages held for sale $ — $ 1,817 $ — $ 1,817 $ (76)
Loans held for sale — 691 — 691 (35)
Loans (1) — 804 12 816 (3,080)
Private equity investments — — 22 22 (52)
Foreclosed assets (2) — 454 — 454 (90)
Operating lease assets — 49 — 49 (3)
$ (3,336)
December 31, 2008
Mortgages held for sale $ — $ 521 $534 $1,055 $ (28)
Loans held for sale — 338 — 338 (105)
Loans (1) — 1,487 107 1,594 (6,400)
Private equity investments 134 — 18 152 (81)
Foreclosed assets (2) — 274 55 329 (165)
Operating lease assets — 186 — 186 (28)
$(6,807)
(1) Represents carrying value and related write-downs of loans for which adjustments are based on the appraised value of the collateral. The carrying value of loans fully
charged-off, which includes unsecured lines and loans, is zero.
(2) Represents the fair value and related losses of foreclosed real estate and other collateral owned that were measured at fair value subsequent to their initial classification
as foreclosed assets.