Wells Fargo 2008 Annual Report Download - page 109
Download and view the complete annual report
Please find page 109 of the 2008 Wells Fargo annual report below. You can navigate through the pages in the report by either clicking on the pages listed below, or by using the keyword search tool below to find specific information within the annual report.-
 1
1 -
2
-
3
-
4
-
5
-
6
-
7
-
8
-
9
-
10
-
11
-
12
-
13
-
14
-
15
-
16
-
17
-
18
-
19
-
20
-
21
-
22
-
23
-
24
-
25
-
26
-
27
-
28
-
29
-
30
-
31
-
32
-
33
-
34
-
35
-
36
-
37
-
38
-
39
-
40
-
41
-
42
-
43
-
44
-
45
-
46
-
47
-
48
-
49
-
50
-
51
-
52
-
53
-
54
-
55
-
56
-
57
-
58
-
59
-
60
-
61
-
62
-
63
-
64
-
65
-
66
-
67
-
68
-
69
-
70
-
71
-
72
-
73
-
74
-
75
-
76
-
77
-
78
-
79
-
80
-
81
-
82
-
83
-
84
-
85
-
86
-
87
-
88
-
89
-
90
-
91
-
92
-
93
-
94
-
95
-
96
-
97
-
98
-
 99
99 -
 100
100 -
 101
101 -
 102
102 -
 103
103 -
 104
104 -
 105
105 -
 106
106 -
 107
107 -
 108
108 -
 109
109 -
 110
110 -
 111
111 -
 112
112 -
 113
113 -
 114
114 -
 115
115 -
 116
116 -
 117
117 -
 118
118 -
 119
119 -
120
-
121
-
122
-
123
-
124
-
125
-
126
-
127
-
128
-
129
-
130
-
131
-
132
-
133
-
134
-
135
-
136
-
137
-
138
-
139
-
140
-
141
-
142
-
143
-
144
-
145
-
146
-
147
-
148
-
149
-
150
-
151
-
152
-
153
-
154
-
155
-
156
-
157
-
158
-
159
-
160
-
161
-
162
-
163
-
164
-
165
-
166
-
167
-
168
-
169
-
170
-
171
-
172
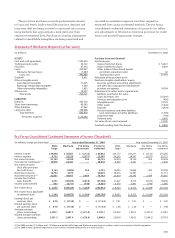
 |
 |

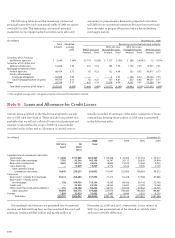
Loan concentrations may exist when there are amounts
loaned to borrowers engaged in similar activities or similar
types of loans extended to a diverse group of borrowers that
would cause them to be similarly impacted by economic or
other conditions. At December 31, 2008 and 2007, we did not
have concentrations representing 10% or more of our total
loan portfolio in commercial loans and lease financing by
industry or commercial real estate loans (other real estate
mortgage and real estate construction) by state or property
type. Our real estate 1-4 family mortgage loans to borrowers
in the state of California represented approximately 14%
of total loans at December 31, 2008, compared with 13% at
December 31, 2007. Of this amount, 3% of total loans were
SOP 03-3 loans. These loans are generally diversified among
the larger metropolitan areas in California, with no single area
consisting of more than 2% of total loans. Changes in real
estate values and underlying economic or market conditions
for these areas are monitored continuously within our credit
risk management process. Beginning in 2007, the residential
real estate markets experienced significant declines in prop-
erty values, and several markets in California, specifically the
Central Valley and several Southern California metropolitan
statistical areas, experienced more severe value adjustments.
Some of our real estate 1-4 family mortgage loans,
including first mortgage and home equity products, include
an interest-only feature as part of the loan terms. At
December 31, 2008, these loans were approximately 11% of
total loans, compared with 20% at December 31, 2007. Most
of these loans are considered to be prime or near prime.
For certain extensions of credit, we may require collateral,
based on our assessment of a customer’s credit risk. We hold
various types of collateral, including accounts receivable,
inventory, land, buildings, equipment, autos, financial
instruments, income-producing commercial properties and
residential real estate. Collateral requirements for each
customer may vary according to the specific credit underwriting,
terms and structure of loans funded immediately or under
a commitment to fund at a later date.
A commitment to extend credit is a legally binding
agreement to lend funds to a customer, usually at a stated
interest rate and for a specified purpose. These commitments
have fixed expiration dates and generally require a fee.
When we make such a commitment, we have credit risk.
The liquidity requirements or credit risk will be lower than
the contractual amount of commitments to extend credit
because a significant portion of these commitments are
expected to expire without being used. Certain commitments
are subject to loan agreements with covenants regarding the
financial performance of the customer or borrowing base
formulas that must be met before we are required to fund the
commitment. We use the same credit policies in extending
credit for unfunded commitments and letters of credit that
we use in making loans. See Note 15 for information on
standby letters of credit.
In addition, we manage the potential risk in credit
commitments by limiting the total amount of arrangements,
both by individual customer and in total, by monitoring the
size and maturity structure of these portfolios and by applying
the same credit standards for all of our credit activities.
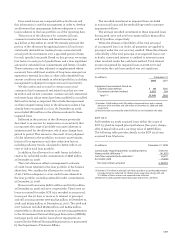
The total of our unfunded loan commitments, net of all
funds lent and all standby and commercial letters of credit
issued under the terms of these commitments, is summarized
by loan category in the following table:
(in millions) December 31,
2008 2007
Commercial and commercial real estate:
Commercial $195,507 $ 89,480
Other real estate mortgage 6,536 2,911
Real estate construction 19,063 9,986
Total commercial and
commercial real estate 221,106 102,377
Consumer:
Real estate 1-4 family first mortgage 36,964 11,861
Real estate 1-4 family junior lien mortgage 78,417 47,763
Credit card 75,776 62,680
Other revolving credit and installment 22,231 16,220
Total consumer 213,388 138,524
Foreign 4,817 980
Total unfunded loan commitments $439,311 $241,881
We have an established process to determine the
adequacy of the allowance for credit losses that assesses the
risks and losses inherent in our portfolio. While we attribute
portions of the allowance to specific loan categories as part
of our analytical process, the entire allowance is used to
absorb credit losses inherent in the total loan portfolio.
At December 31, 2008, the portion of the allowance for
credit losses estimated at a pooled level for consumer loans
and some segments of commercial small business loans was
$16.4 billion. For purposes of determining the allowance for
credit losses, we pool certain loans in our portfolio by product
type, primarily for the auto, credit card and real estate mortgage
portfolios. To achieve greater accuracy, we further segment
selected portfolios. As appropriate, the business groups may
attempt to achieve greater accuracy through segmentation by
sub-product, origination channel, vintage, loss type, geography
and other predictive characteristics. For example, credit cards
are segmented by origination channel and the Home Equity
portfolios are further segmented between liquidating and
nonliquidating. In the case of residential mortgages,
we segment the liquidating Pick-a-Pay portfolio, and further
segment this portfolio based on origination channel.
To measure losses inherent in consumer loans and some
commercial small business loans, we use loss models and
other quantitative, mathematical techniques to forecast losses.
Each business group forecasts losses for loans as of the balance
sheet date over the estimated loss emergence period. During
fourth quarter 2008, we conformed our loss emergence period
for these portfolios to cover 12 months of estimated losses,
which is within Federal Financial Institutions Examination
Council (FFIEC) guidelines and resulted in a $2.7 billion
increase to the allowance for credit losses.