Sallie Mae 2007 Annual Report Download - page 98
Download and view the complete annual report
Please find page 98 of the 2007 Sallie Mae annual report below. You can navigate through the pages in the report by either clicking on the pages listed below, or by using the keyword search tool below to find specific information within the annual report.-
 1
1 -
2
-
3
-
4
-
5
-
6
-
7
-
8
-
9
-
10
-
11
-
12
-
13
-
14
-
15
-
16
-
17
-
18
-
19
-
20
-
21
-
22
-
23
-
24
-
25
-
26
-
27
-
28
-
29
-
30
-
31
-
32
-
33
-
34
-
35
-
36
-
37
-
38
-
39
-
40
-
41
-
42
-
43
-
44
-
45
-
46
-
47
-
48
-
49
-
50
-
51
-
52
-
53
-
54
-
55
-
56
-
57
-
58
-
59
-
60
-
61
-
62
-
63
-
64
-
65
-
66
-
67
-
68
-
69
-
70
-
71
-
72
-
73
-
74
-
75
-
76
-
77
-
78
-
79
-
80
-
81
-
82
-
83
-
84
-
85
-
86
-
87
-
 88
88 -
 89
89 -
 90
90 -
 91
91 -
 92
92 -
 93
93 -
 94
94 -
 95
95 -
 96
96 -
 97
97 -
 98
98 -
 99
99 -
 100
100 -
 101
101 -
 102
102 -
 103
103 -
 104
104 -
 105
105 -
 106
106 -
 107
107 -
 108
108 -
109
-
110
-
111
-
112
-
113
-
114
-
115
-
116
-
117
-
118
-
119
-
120
-
121
-
122
-
123
-
124
-
125
-
126
-
127
-
128
-
129
-
130
-
131
-
132
-
133
-
134
-
135
-
136
-
137
-
138
-
139
-
140
-
141
-
142
-
143
-
144
-
145
-
146
-
147
-
148
-
149
-
150
-
151
-
152
-
153
-
154
-
155
-
156
-
157
-
158
-
159
-
160
-
161
-
162
-
163
-
164
-
165
-
166
-
167
-
168
-
169
-
170
-
171
-
172
-
173
-
174
-
175
-
176
-
177
-
178
-
179
-
180
-
181
-
182
-
183
-
184
-
185
-
186
-
187
-
188
-
189
-
190
-
191
-
192
-
193
-
194
-
195
-
196
-
197
-
198
-
199
-
200
-
201
-
202
-
203
-
204
-
205
-
206
-
207
-
208
-
209
-
210
-
211
-
212
-
213
-
214
-
215
-
216
-
217
-
218
-
219
 |
 |

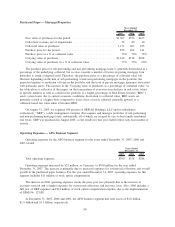
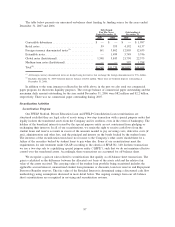
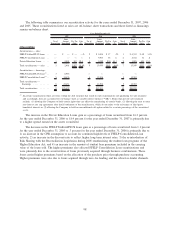
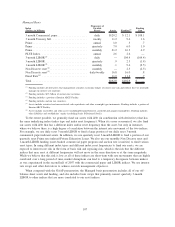
The table below presents our unsecured on-balance sheet funding by funding source for the years ended
December 31, 2007 and 2006.
2007 2006 2007 2006
Debt Issued
For The Years
Ended December 31,
Outstanding at
December 31,
Convertible debentures .......................... $ — $ — $ — $ 1,997
Retail notes .................................. 59 535 4,192 4,137
Foreign currency denominated notes
(1)
.............. 161 3,862 12,805 12,635
Extendible notes............................... — 1,499 5,749 5,746
Global notes (Institutional) ....................... 1,348 5,843 21,750 22,375
Medium-term notes (Institutional) .................. — — 597 1,798
Total
(2)
...................................... $1,568 $11,739 $45,093 $48,688
(1)
All foreign currency denominated notes are hedged using derivatives that exchange the foreign denomination for U.S. dollars.
(2)
Excludes December 31, 2007 brokered deposits balance of $254 million. There were no brokered deposits outstanding at
December 31, 2006.
In addition to the term issuances reflected in the table above, in the past we also used our commercial
paper program for short-term liquidity purposes. The average balance of commercial paper outstanding and the
maximum daily amount outstanding for the year ended December 31, 2006 were $82 million and $2.2 billion,
respectively. There was no commercial paper outstanding during 2007.
Securitization Activities
Securitization Program
Our FFELP Stafford, Private Education Loan and FFELP Consolidation Loan securitizations are
structured such that they are legal sales of assets using a two-step transaction with a special purpose entity that
legally isolates the transferred assets from the Company and its creditors, even in the event of bankruptcy. The
holders of the beneficial interests issued by the special purpose entity are not constrained from pledging or
exchanging their interests. In all of our securitizations, we retain the right to receive cash flows from the
student loans and reserve accounts in excess of the amounts needed to pay servicing costs, derivative costs (if
any), administration and other fees, and the principal and interest on the bonds backed by the student loans.
The investors of the securitization trusts have no recourse to the Company’s other assets should there be a
failure of the securities backed by student loans to pay when due. Some of our securitizations meet the
requirements for sale treatment under GAAP, according to the criteria of SFAS No. 140. In these transactions
we use a two-step sale to a qualifying special purpose entity (“QSPE”), such that we do not maintain effective
control over the transferred assets. Accordingly, these transactions are accounted for off-balance sheet.
We recognize a gain on sales related to securitizations that qualify as off-balance sheet transactions. The
gain is calculated as the difference between the allocated cost basis of the assets sold and the relative fair
value of the assets received. The carrying value of the student loan portfolio being securitized includes the
applicable accrued interest, unamortized student loan premiums or discounts, loan loss reserves and Repayment
Borrower Benefits reserves. The fair value of the Residual Interest is determined using a discounted cash flow
methodology using assumptions discussed in more detail below. The ongoing earnings from our off-balance
sheet securitizations are recognized in servicing and securitization revenue.
97