Sallie Mae 2007 Annual Report Download - page 173
Download and view the complete annual report
Please find page 173 of the 2007 Sallie Mae annual report below. You can navigate through the pages in the report by either clicking on the pages listed below, or by using the keyword search tool below to find specific information within the annual report.-
 1
1 -
2
-
3
-
4
-
5
-
6
-
7
-
8
-
9
-
10
-
11
-
12
-
13
-
14
-
15
-
16
-
17
-
18
-
19
-
20
-
21
-
22
-
23
-
24
-
25
-
26
-
27
-
28
-
29
-
30
-
31
-
32
-
33
-
34
-
35
-
36
-
37
-
38
-
39
-
40
-
41
-
42
-
43
-
44
-
45
-
46
-
47
-
48
-
49
-
50
-
51
-
52
-
53
-
54
-
55
-
56
-
57
-
58
-
59
-
60
-
61
-
62
-
63
-
64
-
65
-
66
-
67
-
68
-
69
-
70
-
71
-
72
-
73
-
74
-
75
-
76
-
77
-
78
-
79
-
80
-
81
-
82
-
83
-
84
-
85
-
86
-
87
-
88
-
89
-
90
-
91
-
92
-
93
-
94
-
95
-
96
-
97
-
98
-
99
-
100
-
101
-
102
-
103
-
104
-
105
-
106
-
107
-
108
-
109
-
110
-
111
-
112
-
113
-
114
-
115
-
116
-
117
-
118
-
119
-
120
-
121
-
122
-
123
-
124
-
125
-
126
-
127
-
128
-
129
-
130
-
131
-
132
-
133
-
134
-
135
-
136
-
137
-
138
-
139
-
140
-
141
-
142
-
143
-
144
-
145
-
146
-
147
-
148
-
149
-
150
-
151
-
152
-
153
-
154
-
155
-
156
-
157
-
158
-
159
-
160
-
161
-
162
-
 163
163 -
 164
164 -
 165
165 -
 166
166 -
 167
167 -
 168
168 -
 169
169 -
 170
170 -
 171
171 -
 172
172 -
 173
173 -
 174
174 -
 175
175 -
 176
176 -
 177
177 -
 178
178 -
 179
179 -
 180
180 -
 181
181 -
 182
182 -
 183
183 -
184
-
185
-
186
-
187
-
188
-
189
-
190
-
191
-
192
-
193
-
194
-
195
-
196
-
197
-
198
-
199
-
200
-
201
-
202
-
203
-
204
-
205
-
206
-
207
-
208
-
209
-
210
-
211
-
212
-
213
-
214
-
215
-
216
-
217
-
218
-
219
 |
 |

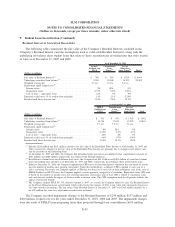
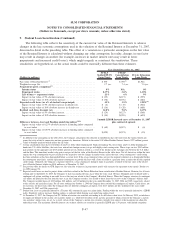
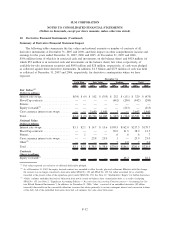
10. Derivative Financial Instruments (Continued)
Summary of Derivative Financial Statement Impact
The following tables summarize the fair values and notional amounts or number of contracts of all
derivative instruments at December 31, 2007 and 2006, and their impact on other comprehensive income and
earnings for the years ended December 31, 2007, 2006 and 2005. At December 31, 2007 and 2006,
$196 million (none of which is in restricted cash and investments on the balance sheet) and $418 million (of
which $53 million is in restricted cash and investments on the balance sheet) fair value, respectively, of
available-for-sale investment securities and $890 million and $28 million, respectively, of cash were pledged
as collateral against these derivative instruments. In addition, $1.3 billion and $275 million of cash was held
as collateral at December 31, 2007 and 2006, respectively, for derivative counterparties where we have
exposure.
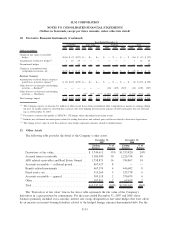
2007 2006 2007 2006 2007 2006 2007 2006
Cash Flow Fair Value Trading Total
December 31,
Fair Values
(1)
(Dollars in millions)
Interest rate swaps .................. $(34) $ (9) $ 102 $ (355) $ 252 $ (111) $ 320 $ (475)
Floor/Cap contracts ................. — — — — (442) (200) (442) (200)
Futures .......................... — — — — — — — —
Equity forwards
(2)
.................. — — — — — (213) — (213)
Cross currency interest rate swaps . ..... — — 3,640 1,440 3 — 3,643 1,440
Total ............................ $(34) $ (9) $3,742 $1,085 $ (187) $ (524) $3,521 $ 552
Notional Value
(Dollars in billions)
Interest rate swaps .................. $3.1 $2.1 $ 14.7 $ 15.6 $199.5 $162.0 $217.3 $179.7
Floor/Cap contracts ................. — — — — 38.9 21.5 38.9 21.5
Futures .......................... — .1 — — .6 .6 .6 .7
Cross currency interest rate swaps . ..... — — 23.8 23.0 .1 — 23.9 23.0
Other
(3)
.......................... — — — — .7 2.0 .7 2.0
Total ............................ $3.1 $2.2 $ 38.5 $ 38.6 $239.8 $186.1 $281.4 $226.9
Contracts
(Shares in millions)
Equity forwards
(2)
.................. — — — — — 48.2 — 48.2
(1)
Fair values reported are exclusive of collateral held and/or pledged.
(2)
As of December 31, 2007, the equity forward contract was amended to allow for only physical settlement. Effective with this change,
the contract was no longer considered a derivative under SFAS No. 150 and SFAS No. 133, but rather accounted for as a liability
(recorded at the present value of the repurchase price) under SFAS No. 150. See Note 12, “Stockholders’ Equity” for further discussion.
(3)
“Other” includes embedded derivatives bifurcated from newly issued on-balance sheet securitization debt, as a result of adopting
SFAS No. 155 (see Note 2, “Significant Accounting Policies — Recently Issued Accounting Pronouncements — Accounting for Cer-
tain Hybrid Financial Instruments”). In addition, for December 31, 2006, “other” consisted of an embedded derivative ($2 billion
notional) bifurcated from the convertible debenture issuance that relates primarily to certain contingent interest and conversion features
of the debt. All of the embedded derivatives have had a de minimis fair value since bifurcation.
F-52
SLM CORPORATION
NOTES TO CONSOLIDATED FINANCIAL STATEMENTS
(Dollars in thousands, except per share amounts, unless otherwise stated)