Sallie Mae 2007 Annual Report Download - page 102
Download and view the complete annual report
Please find page 102 of the 2007 Sallie Mae annual report below. You can navigate through the pages in the report by either clicking on the pages listed below, or by using the keyword search tool below to find specific information within the annual report.-
 1
1 -
2
-
3
-
4
-
5
-
6
-
7
-
8
-
9
-
10
-
11
-
12
-
13
-
14
-
15
-
16
-
17
-
18
-
19
-
20
-
21
-
22
-
23
-
24
-
25
-
26
-
27
-
28
-
29
-
30
-
31
-
32
-
33
-
34
-
35
-
36
-
37
-
38
-
39
-
40
-
41
-
42
-
43
-
44
-
45
-
46
-
47
-
48
-
49
-
50
-
51
-
52
-
53
-
54
-
55
-
56
-
57
-
58
-
59
-
60
-
61
-
62
-
63
-
64
-
65
-
66
-
67
-
68
-
69
-
70
-
71
-
72
-
73
-
74
-
75
-
76
-
77
-
78
-
79
-
80
-
81
-
82
-
83
-
84
-
85
-
86
-
87
-
88
-
89
-
90
-
91
-
 92
92 -
 93
93 -
 94
94 -
 95
95 -
 96
96 -
 97
97 -
 98
98 -
 99
99 -
 100
100 -
 101
101 -
 102
102 -
 103
103 -
 104
104 -
 105
105 -
 106
106 -
 107
107 -
 108
108 -
 109
109 -
 110
110 -
 111
111 -
 112
112 -
113
-
114
-
115
-
116
-
117
-
118
-
119
-
120
-
121
-
122
-
123
-
124
-
125
-
126
-
127
-
128
-
129
-
130
-
131
-
132
-
133
-
134
-
135
-
136
-
137
-
138
-
139
-
140
-
141
-
142
-
143
-
144
-
145
-
146
-
147
-
148
-
149
-
150
-
151
-
152
-
153
-
154
-
155
-
156
-
157
-
158
-
159
-
160
-
161
-
162
-
163
-
164
-
165
-
166
-
167
-
168
-
169
-
170
-
171
-
172
-
173
-
174
-
175
-
176
-
177
-
178
-
179
-
180
-
181
-
182
-
183
-
184
-
185
-
186
-
187
-
188
-
189
-
190
-
191
-
192
-
193
-
194
-
195
-
196
-
197
-
198
-
199
-
200
-
201
-
202
-
203
-
204
-
205
-
206
-
207
-
208
-
209
-
210
-
211
-
212
-
213
-
214
-
215
-
216
-
217
-
218
-
219
 |
 |

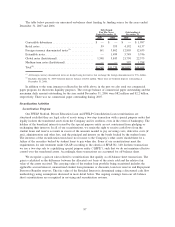
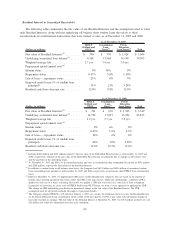
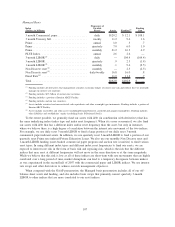
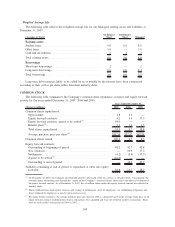
The following table summarizes the components of servicing and securitization revenue for the years
ended December 31, 2007, 2006 and 2005.
2007 2006 2005
Years Ended December 31,
Servicing revenue ..................................... $ 285 $ 336 $ 323
Securitization revenue, before Net Embedded Floor Income,
impairment and unrealized fair value adjustment ............. 419 368 270
Servicing and securitization revenue, before Net Embedded Floor
Income, impairment and unrealized fair value adjustment ...... 704 704 593
Embedded Floor Income ................................ 20 14 81
Less: Floor Income previously recognized in gain calculation ..... (9) (8) (57)
Net Embedded Floor Income ............................. 11 6 24
Servicing and securitization revenue, before impairment and
unrealized fair value adjustment ......................... 715 710 617
Unrealized fair value adjustment
(1)
......................... (24) — —
Retained Interest impairment ............................. (254) (157) (260)
Total servicing and securitization revenue .................... $ 437 $ 553 $ 357
Average off-balance sheet student loans ..................... $42,411 $46,336 $41,220
Average balance of Retained Interest ....................... $ 3,385 $ 3,101 $ 2,476
Servicing and securitization revenue as a percentage of the average
balance of off-balance sheet student loans (annualized) ........ 1.03% 1.19% .87%
(1)
The Company adopted SFAS No. 155 on January 1, 2007. SFAS No. 155 requires the Company to identify and bifurcate embed-
ded derivatives from the Residual Interest. However, SFAS No. 155 does allow the Company to elect to carry the entire Residual
Interest at fair value through earnings rather than bifurcate such embedded derivatives. For the off-balance sheet securitizations
that settled in the year ended December 31, 2007, the Company elected to carry the entire Residual Interest recorded at fair value
through earnings. As a result of this election, all changes in the fair value of the Residual Interests for that securitization are
recorded through earnings. Management anticipates electing to carry future Residual Interests at fair value through earnings. For
securitizations settling prior to January 1, 2007, changes in the fair value of Residual Interest were recorded in other comprehen-
sive income, unless impaired, for the years presented. Effective with the Company’s adoption of SFAS No. 159, “The Fair Value
Option for Financial Assets and Financial Liabilities — Including an Amendment of FASB Statement No. 115,” the Company
has elected the fair value option on all of its Residual Interests and will record future change in fair value through income begin-
ning on January 1, 2008.
Servicing and securitization revenue is primarily driven by the average balance of off-balance sheet
student loans, the amount of and the difference in the timing of Embedded Floor Income recognition on off-
balance sheet student loans, Retained Interest impairments, and the fair value adjustment related to those
Residual Interests where the Company has elected to carry such Residual Interests at fair value through
earnings under SFAS No. 155 as discussed in the above table. The increase in securitization revenue, before
Net Embedded Floor Income, impairment and unrealized fair value adjustment, from 2005 to 2007, is
primarily due to the continued increase in the amount of Private Education Loan Residual Interests as a
percentage of the total Residual Interests. Private Education Loan Residual Interests generate a higher yield
than FFELP loan Residual Interests.
The Company recorded impairments to the Retained Interests of $254 million, $157 million and
$260 million, respectively, for the years ended December 31, 2007, 2006, and 2005. The impairment charges
were the result of FFELP loans prepaying faster than projected through loan consolidations ($110 million,
$104 million and $256 million for the years ended December 31, 2007, 2006 and 2005, respectively),
impairment to the Floor Income component of the Company’s Retained Interest due to increases in interest
rates during the period ($24 million, $53 million and $4 million for the years ended December 31, 2007, 2006,
and 2005, respectively), and increases in prepayments, defaults, and the discount rate related to Private
Education Loans ($120 million for the year ended December 31, 2007).
101