Sallie Mae 2007 Annual Report Download - page 198
Download and view the complete annual report
Please find page 198 of the 2007 Sallie Mae annual report below. You can navigate through the pages in the report by either clicking on the pages listed below, or by using the keyword search tool below to find specific information within the annual report.-
 1
1 -
2
-
3
-
4
-
5
-
6
-
7
-
8
-
9
-
10
-
11
-
12
-
13
-
14
-
15
-
16
-
17
-
18
-
19
-
20
-
21
-
22
-
23
-
24
-
25
-
26
-
27
-
28
-
29
-
30
-
31
-
32
-
33
-
34
-
35
-
36
-
37
-
38
-
39
-
40
-
41
-
42
-
43
-
44
-
45
-
46
-
47
-
48
-
49
-
50
-
51
-
52
-
53
-
54
-
55
-
56
-
57
-
58
-
59
-
60
-
61
-
62
-
63
-
64
-
65
-
66
-
67
-
68
-
69
-
70
-
71
-
72
-
73
-
74
-
75
-
76
-
77
-
78
-
79
-
80
-
81
-
82
-
83
-
84
-
85
-
86
-
87
-
88
-
89
-
90
-
91
-
92
-
93
-
94
-
95
-
96
-
97
-
98
-
99
-
100
-
101
-
102
-
103
-
104
-
105
-
106
-
107
-
108
-
109
-
110
-
111
-
112
-
113
-
114
-
115
-
116
-
117
-
118
-
119
-
120
-
121
-
122
-
123
-
124
-
125
-
126
-
127
-
128
-
129
-
130
-
131
-
132
-
133
-
134
-
135
-
136
-
137
-
138
-
139
-
140
-
141
-
142
-
143
-
144
-
145
-
146
-
147
-
148
-
149
-
150
-
151
-
152
-
153
-
154
-
155
-
156
-
157
-
158
-
159
-
160
-
161
-
162
-
163
-
164
-
165
-
166
-
167
-
168
-
169
-
170
-
171
-
172
-
173
-
174
-
175
-
176
-
177
-
178
-
179
-
180
-
181
-
182
-
183
-
184
-
185
-
186
-
187
-
 188
188 -
 189
189 -
 190
190 -
 191
191 -
 192
192 -
 193
193 -
 194
194 -
 195
195 -
 196
196 -
 197
197 -
 198
198 -
 199
199 -
 200
200 -
 201
201 -
 202
202 -
 203
203 -
 204
204 -
 205
205 -
 206
206 -
 207
207 -
 208
208 -
209
-
210
-
211
-
212
-
213
-
214
-
215
-
216
-
217
-
218
-
219
 |
 |

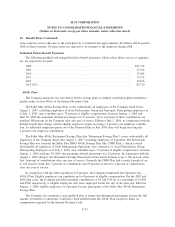
19. Income Taxes (Continued)
to the tolling of various statute of limitations periods. When considering both tax and interest amounts, such
change could be approximately $3 million to $5 million.
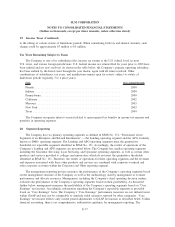
Tax Years Remaining Subject to Exam
The Company or one of its subsidiaries files income tax returns at the U.S. federal level, in most
U.S. states, and various foreign jurisdictions. U.S. federal income tax returns filed for years prior to 2003 have
been audited and are now resolved. As shown in the table below, the Company’s primary operating subsidiary
has been audited by the listed states through the year shown, again with all issues resolved. Other
combinations of subsidiaries, tax years, and jurisdictions remain open for review, subject to statute of
limitations periods (typically 3 to 4 prior years).
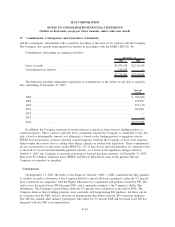
State Year audited through
Florida . . . .................................................... 2000
Indiana . . . .................................................... 2000
Pennsylvania................................................... 2000
California . .................................................... 2002
Missouri . . .................................................... 2003
NewYork..................................................... 2003
Texas........................................................ 2004
The Company recognizes interest accrued related to unrecognized tax benefits in income tax expense and
penalties in operating expenses.
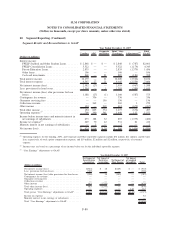
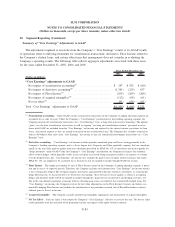
20. Segment Reporting
The Company has two primary operating segments as defined in SFAS No. 131, “Disclosures about
Segments of an Enterprise and Related Information” — the Lending operating segment and the APG, formerly
known as DMO, operating segment. The Lending and APG operating segments meet the quantitative
thresholds for reportable segments identified in SFAS No. 131. Accordingly, the results of operations of the
Company’s Lending and APG segments are presented below. The Company has smaller operating segments
including the Guarantor Servicing, Loan Servicing, and Upromise operating segments, as well as certain other
products and services provided to colleges and universities which do not meet the quantitative thresholds
identified in SFAS No. 131. Therefore, the results of operations for these operating segments and the revenues
and expenses associated with these other products and services are combined with corporate overhead and
other corporate activities within the Corporate and Other reporting segment.
The management reporting process measures the performance of the Company’s operating segments based
on the management structure of the Company as well as the methodology used by management to evaluate
performance and allocate resources. Management, including the Company’s chief operating decision makers,
evaluates the performance of the Company’s operating segments based on their profitability. As discussed
further below, management measures the profitability of the Company’s operating segments based on “Core
Earnings” net income. Accordingly, information regarding the Company’s reportable segments is provided
based on “Core Earnings” basis. The Company’s “Core Earnings” performance measures are not defined terms
within GAAP and may not be comparable to similarly titled measures reported by other companies. “Core
Earnings” net income reflects only current period adjustments to GAAP net income as described below. Unlike
financial accounting, there is no comprehensive, authoritative guidance for management reporting. The
F-77
SLM CORPORATION
NOTES TO CONSOLIDATED FINANCIAL STATEMENTS
(Dollars in thousands, except per share amounts, unless otherwise stated)