Sallie Mae 2007 Annual Report Download - page 191
Download and view the complete annual report
Please find page 191 of the 2007 Sallie Mae annual report below. You can navigate through the pages in the report by either clicking on the pages listed below, or by using the keyword search tool below to find specific information within the annual report.-
 1
1 -
2
-
3
-
4
-
5
-
6
-
7
-
8
-
9
-
10
-
11
-
12
-
13
-
14
-
15
-
16
-
17
-
18
-
19
-
20
-
21
-
22
-
23
-
24
-
25
-
26
-
27
-
28
-
29
-
30
-
31
-
32
-
33
-
34
-
35
-
36
-
37
-
38
-
39
-
40
-
41
-
42
-
43
-
44
-
45
-
46
-
47
-
48
-
49
-
50
-
51
-
52
-
53
-
54
-
55
-
56
-
57
-
58
-
59
-
60
-
61
-
62
-
63
-
64
-
65
-
66
-
67
-
68
-
69
-
70
-
71
-
72
-
73
-
74
-
75
-
76
-
77
-
78
-
79
-
80
-
81
-
82
-
83
-
84
-
85
-
86
-
87
-
88
-
89
-
90
-
91
-
92
-
93
-
94
-
95
-
96
-
97
-
98
-
99
-
100
-
101
-
102
-
103
-
104
-
105
-
106
-
107
-
108
-
109
-
110
-
111
-
112
-
113
-
114
-
115
-
116
-
117
-
118
-
119
-
120
-
121
-
122
-
123
-
124
-
125
-
126
-
127
-
128
-
129
-
130
-
131
-
132
-
133
-
134
-
135
-
136
-
137
-
138
-
139
-
140
-
141
-
142
-
143
-
144
-
145
-
146
-
147
-
148
-
149
-
150
-
151
-
152
-
153
-
154
-
155
-
156
-
157
-
158
-
159
-
160
-
161
-
162
-
163
-
164
-
165
-
166
-
167
-
168
-
169
-
170
-
171
-
172
-
173
-
174
-
175
-
176
-
177
-
178
-
179
-
180
-
 181
181 -
 182
182 -
 183
183 -
 184
184 -
 185
185 -
 186
186 -
 187
187 -
 188
188 -
 189
189 -
 190
190 -
 191
191 -
 192
192 -
 193
193 -
 194
194 -
 195
195 -
 196
196 -
 197
197 -
 198
198 -
 199
199 -
 200
200 -
 201
201 -
202
-
203
-
204
-
205
-
206
-
207
-
208
-
209
-
210
-
211
-
212
-
213
-
214
-
215
-
216
-
217
-
218
-
219
 |
 |

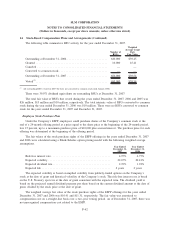
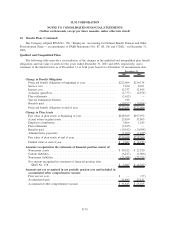
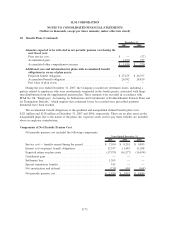
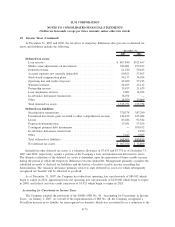
18. Benefit Plans (Continued)
The Company adopted SFAS No. 158, “Employers’ Accounting for Defined Benefit Pension and Other
Postretirement Plans — an amendment of FASB Statements Nos. 87, 88, 106 and 132(R),” on December 31,
2006.
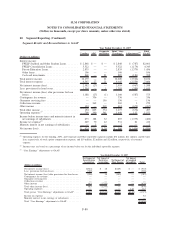
Qualified and Nonqualified Plans
The following tables provide a reconciliation of the changes in the qualified and nonqualified plan benefit
obligations and fair value of assets for the years ended December 31, 2007 and 2006, respectively, and a
statement of the funded status as of December 31 of both years based on a December 31 measurement date.
2007 2006
December 31,
Change in Benefit Obligation
Projected benefit obligation at beginning of year.................... $222,606 $216,138
Service cost............................................... 7,100 8,291
Interest cost............................................... 12,337 11,445
Actuarial (gain)/loss......................................... (1,777) (2,274)
Plan settlements............................................ (2,615) —
Special termination benefits ................................... 912 —
Benefits paid .............................................. (10,912) (10,994)
Projected benefit obligation at end of year ........................ $227,651 $222,606
Change in Plan Assets
Fair value of plan assets at beginning of year ...................... $218,369 $197,972
Actual return on plan assets ................................... 23,850 31,805
Employer contribution ....................................... 3,466 1,015
Plan settlements............................................ (2,615) —
Benefits paid .............................................. (10,912) (10,994)
Administrative payments ..................................... (1,460) (1,429)
Fair value of plan assets at end of year . . . ........................ $230,698 $218,369
Funded status at end of year................................... $ 3,047 $ (4,237)
Amounts recognized in the statement of financial position consist of:
Noncurrent assets .......................................... $ 30,322 $ 22,520
Current liabilities ........................................... (6,227) (1,006)
Noncurrent liabilities ........................................ (21,048) (25,751)
Net amount recognized in statement of financial position after
SFASNo.158........................................... $ 3,047 $ (4,237)
Amounts not yet recognized in net periodic pension cost and included in
accumulated other comprehensive income:
Prior service cost ........................................... $ — (37)
Accumulated gain .......................................... 31,843 25,142
Accumulated other comprehensive income ........................ $ 31,843 $ 25,105
F-70
SLM CORPORATION
NOTES TO CONSOLIDATED FINANCIAL STATEMENTS
(Dollars in thousands, except per share amounts, unless otherwise stated)