Sallie Mae 2007 Annual Report Download - page 75
Download and view the complete annual report
Please find page 75 of the 2007 Sallie Mae annual report below. You can navigate through the pages in the report by either clicking on the pages listed below, or by using the keyword search tool below to find specific information within the annual report.-
 1
1 -
2
-
3
-
4
-
5
-
6
-
7
-
8
-
9
-
10
-
11
-
12
-
13
-
14
-
15
-
16
-
17
-
18
-
19
-
20
-
21
-
22
-
23
-
24
-
25
-
26
-
27
-
28
-
29
-
30
-
31
-
32
-
33
-
34
-
35
-
36
-
37
-
38
-
39
-
40
-
41
-
42
-
43
-
44
-
45
-
46
-
47
-
48
-
49
-
50
-
51
-
52
-
53
-
54
-
55
-
56
-
57
-
58
-
59
-
60
-
61
-
62
-
63
-
64
-
 65
65 -
 66
66 -
 67
67 -
 68
68 -
 69
69 -
 70
70 -
 71
71 -
 72
72 -
 73
73 -
 74
74 -
 75
75 -
 76
76 -
 77
77 -
 78
78 -
 79
79 -
 80
80 -
 81
81 -
 82
82 -
 83
83 -
 84
84 -
 85
85 -
86
-
87
-
88
-
89
-
90
-
91
-
92
-
93
-
94
-
95
-
96
-
97
-
98
-
99
-
100
-
101
-
102
-
103
-
104
-
105
-
106
-
107
-
108
-
109
-
110
-
111
-
112
-
113
-
114
-
115
-
116
-
117
-
118
-
119
-
120
-
121
-
122
-
123
-
124
-
125
-
126
-
127
-
128
-
129
-
130
-
131
-
132
-
133
-
134
-
135
-
136
-
137
-
138
-
139
-
140
-
141
-
142
-
143
-
144
-
145
-
146
-
147
-
148
-
149
-
150
-
151
-
152
-
153
-
154
-
155
-
156
-
157
-
158
-
159
-
160
-
161
-
162
-
163
-
164
-
165
-
166
-
167
-
168
-
169
-
170
-
171
-
172
-
173
-
174
-
175
-
176
-
177
-
178
-
179
-
180
-
181
-
182
-
183
-
184
-
185
-
186
-
187
-
188
-
189
-
190
-
191
-
192
-
193
-
194
-
195
-
196
-
197
-
198
-
199
-
200
-
201
-
202
-
203
-
204
-
205
-
206
-
207
-
208
-
209
-
210
-
211
-
212
-
213
-
214
-
215
-
216
-
217
-
218
-
219
 |
 |

1to24
months
25 to 48
months
More than
48 months
After
Dec. 31,
2005
(1)
Total
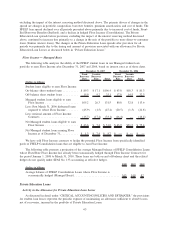
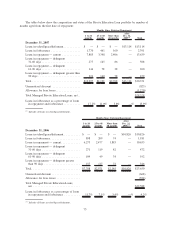
Months Since Entering Repayment
December 31, 2005
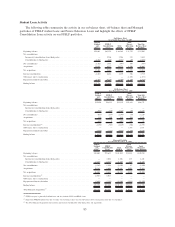
Loans in-school/grace/deferment ........... $ — $ — $ — $7,980 $ 7,980
Loans in forbearance.................... 667 173 77 — 917
Loans in repayment — current............. 4,508 1,796 1,453 — 7,757
Loans in repayment — delinquent 31-60 days. . 168 78 56 — 302
Loans in repayment — delinquent 61-90 days. . 63 30 19 — 112
Loans in repayment — delinquent greater than
90 days ............................ 72 44 28 — 144
Total ............................... $5,478 $2,121 $1,633 $7,980 $17,212
Unamortized discount ................... (493)
Allowance for loan losses ................ (282)
Total Managed Private Education Loans, net . . $16,437
Loans in forbearance as a percentage of loans
in repayment and forbearance ........... 12.2% 8.2% 4.7% —% 9.9%
(1)
Includes all loans in-school/grace/deferment.
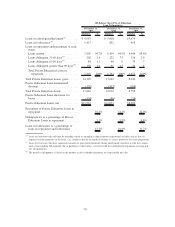
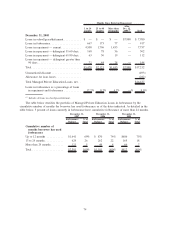
The table below stratifies the portfolio of Managed Private Education Loans in forbearance by the
cumulative number of months the borrower has used forbearance as of the dates indicated. As detailed in the
table below, 5 percent of loans currently in forbearance have cumulative forbearance of more than 24 months.
Forbearance
Balance
%of
Total
Forbearance
Balance
%of
Total
Forbearance
Balance
%of
Total
December 31,
2007
December 31,
2006
December 31,
2005
Cumulative number of
months borrower has used
forbearance
Up to 12 months ........... $1,641 69% $ 870 74% $686 75%
13 to 24 months ............ 629 26 262 22 165 18
More than 24 months . . ...... 121 5 49 4 66 7
Total .................... $2,391 100% $1,181 100% $917 100%
74