Sallie Mae 2007 Annual Report Download - page 86
Download and view the complete annual report
Please find page 86 of the 2007 Sallie Mae annual report below. You can navigate through the pages in the report by either clicking on the pages listed below, or by using the keyword search tool below to find specific information within the annual report.-
 1
1 -
2
-
3
-
4
-
5
-
6
-
7
-
8
-
9
-
10
-
11
-
12
-
13
-
14
-
15
-
16
-
17
-
18
-
19
-
20
-
21
-
22
-
23
-
24
-
25
-
26
-
27
-
28
-
29
-
30
-
31
-
32
-
33
-
34
-
35
-
36
-
37
-
38
-
39
-
40
-
41
-
42
-
43
-
44
-
45
-
46
-
47
-
48
-
49
-
50
-
51
-
52
-
53
-
54
-
55
-
56
-
57
-
58
-
59
-
60
-
61
-
62
-
63
-
64
-
65
-
66
-
67
-
68
-
69
-
70
-
71
-
72
-
73
-
74
-
75
-
 76
76 -
 77
77 -
 78
78 -
 79
79 -
 80
80 -
 81
81 -
 82
82 -
 83
83 -
 84
84 -
 85
85 -
 86
86 -
 87
87 -
 88
88 -
 89
89 -
 90
90 -
 91
91 -
 92
92 -
 93
93 -
 94
94 -
 95
95 -
 96
96 -
97
-
98
-
99
-
100
-
101
-
102
-
103
-
104
-
105
-
106
-
107
-
108
-
109
-
110
-
111
-
112
-
113
-
114
-
115
-
116
-
117
-
118
-
119
-
120
-
121
-
122
-
123
-
124
-
125
-
126
-
127
-
128
-
129
-
130
-
131
-
132
-
133
-
134
-
135
-
136
-
137
-
138
-
139
-
140
-
141
-
142
-
143
-
144
-
145
-
146
-
147
-
148
-
149
-
150
-
151
-
152
-
153
-
154
-
155
-
156
-
157
-
158
-
159
-
160
-
161
-
162
-
163
-
164
-
165
-
166
-
167
-
168
-
169
-
170
-
171
-
172
-
173
-
174
-
175
-
176
-
177
-
178
-
179
-
180
-
181
-
182
-
183
-
184
-
185
-
186
-
187
-
188
-
189
-
190
-
191
-
192
-
193
-
194
-
195
-
196
-
197
-
198
-
199
-
200
-
201
-
202
-
203
-
204
-
205
-
206
-
207
-
208
-
209
-
210
-
211
-
212
-
213
-
214
-
215
-
216
-
217
-
218
-
219
 |
 |

FFELP
Stafford
and
Other
(1)
FFELP
Consolidation
Loans
Total
FFELP
Total
Private
Education
Loans
Total On-
Balance Sheet
Portfolio
On-Balance Sheet
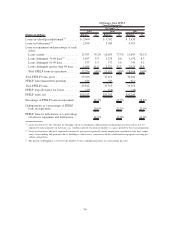
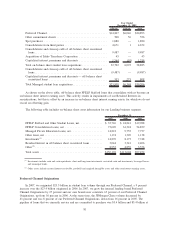
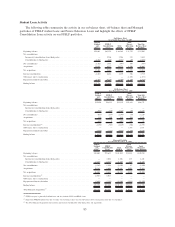
Year Ended December 31, 2005
Beginning balance . . . . . . . . . . . . . . . . . . . . . . . . . . . . . . . . . . . . . . . . . . $18,965 $41,596 $ 60,561 $ 5,420 $ 65,981
Net consolidations:
Incremental consolidations from third parties . . . . . . . . . . . . . . . . . . . . . . . . . — 4,671 4,671 1 4,672
Consolidations to third parties . . . . . . . . . . . . . . . . . . . . . . . . . . . . . . . . . . . (1,236) (1,180) (2,416) (11) (2,427)
Net consolidations . . . . . . . . . . . . . . . . . . . . . . . . . . . . . . . . . . . . . . . . . . (1,236) 3,491 2,255 (10) 2,245
Acquisitions . . . . . . . . . . . . . . . . . . . . . . . . . . . . . . . . . . . . . . . . . . . . . 16,837 1,795 18,632 6,091 24,723
Net acquisitions . . . . . . . . . . . . . . . . . . . . . . . . . . . . . . . . . . . . . . . . . . . 15,601 5,286 20,887 6,081 26,968
Internal consolidations . . . . . . . . . . . . . . . . . . . . . . . . . . . . . . . . . . . . . . . (5,604) 14,020 8,416 — 8,416
Off-balance sheet securitizations . . . . . . . . . . . . . . . . . . . . . . . . . . . . . . . . . . (6,561) (4,044) (10,605) (2,791) (13,396)
Repayments/claims/resales/other . . . . . . . . . . . . . . . . . . . . . . . . . . . . . . . . . . (2,413) (1,999) (4,412) (953) (5,365)
Ending balance . . . . . . . . . . . . . . . . . . . . . . . . . . . . . . . . . . . . . . . . . . . $19,988 $54,859 $ 74,847 $ 7,757 $ 82,604
FFELP
Stafford
and
Other
(1)
FFELP
Consolidation
Loans
Total
FFELP
Total
Private
Education
Loans
Total Off-
Balance Sheet
Portfolio
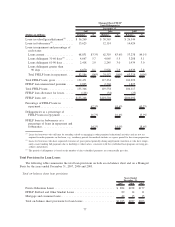
Off-Balance Sheet
Year Ended December 31, 2005
Beginning balance . . . . . . . . . . . . . . . . . . . . . . . . . . . . . . . . . . . . . . . . . . $27,825 $ 7,570 $35,395 $6,062 $41,457
Net consolidations:
Incremental consolidations from third parties. . . . . . . . . . . . . . . . . . . . . . . . . . — — — — —
Consolidations to third parties . . . . . . . . . . . . . . . . . . . . . . . . . . . . . . . . . . . (1,853) (400) (2,253) (18) (2,271)
Net consolidations . . . . . . . . . . . . . . . . . . . . . . . . . . . . . . . . . . . . . . . . . . (1,853) (400) (2,253) (18) (2,271)
Acquisitions . . . . . . . . . . . . . . . . . . . . . . . . . . . . . . . . . . . . . . . . . . . . . . 361 175 536 275 811
Net acquisitions. . . . . . . . . . . . . . . . . . . . . . . . . . . . . . . . . . . . . . . . . . . . (1,492) (225) (1,717) 257 (1,460)
Internal consolidations
(2)
. . . . . . . . . . . . . . . . . . . . . . . . . . . . . . . . . . . . . . . (8,407) (9) (8,416) — (8,416)
Off-balance sheet securitizations . . . . . . . . . . . . . . . . . . . . . . . . . . . . . . . . . . 6,561 4,044 10,605 2,791 13,396
Repayments/claims/resales/other . . . . . . . . . . . . . . . . . . . . . . . . . . . . . . . . . . (3,817) (805) (4,622) (430) (5,052)
Ending balance . . . . . . . . . . . . . . . . . . . . . . . . . . . . . . . . . . . . . . . . . . . . $20,670 $10,575 $31,245 $8,680 $39,925
FFELP
Stafford
and
Other
(1)
FFELP
Consolidation
Loans
Total
FFELP
Total
Private
Education
Loans
Total Managed
Basis Portfolio
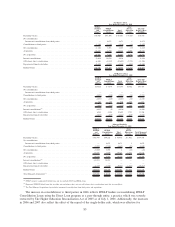
Managed Portfolio
Year Ended December 31, 2005
Beginning balance . . . . . . . . . . . . . . . . . . . . . . . . . . . . . . . . . . . . . . . . $ 46,790 $49,166 $ 95,956 $11,482 $107,438
Net consolidations:
Incremental consolidations from third parties . . . . . . . . . . . . . . . . . . . . . . . . — 4,671 4,671 1 4,672
Consolidations to third parties . . . . . . . . . . . . . . . . . . . . . . . . . . . . . . . . . . (3,089) (1,580) (4,669) (29) (4,698)
Net consolidations . . . . . . . . . . . . . . . . . . . . . . . . . . . . . . . . . . . . . . . . (3,089) 3,091 2 (28) (26)
Acquisitions . . . . . . . . . . . . . . . . . . . . . . . . . . . . . . . . . . . . . . . . . . . . 17,198 1,970 19,168 6,366 25,534
Net acquisitions . . . . . . . . . . . . . . . . . . . . . . . . . . . . . . . . . . . . . . . . . . 14,109 5,061 19,170 6,338 25,508
Internal consolidations
(2)
. . . . . . . . . . . . . . . . . . . . . . . . . . . . . . . . . . . . . (14,011) 14,011 — — —
Off-balance sheet securitizations . . . . . . . . . . . . . . . . . . . . . . . . . . . . . . . . — — — — —
Repayments/claims/resales/other . . . . . . . . . . . . . . . . . . . . . . . . . . . . . . . . . (6,230) (2,804) (9,034) (1,383) (10,417)
Ending balance . . . . . . . . . . . . . . . . . . . . . . . . . . . . . . . . . . . . . . . . . . $ 40,658 $65,434 $106,092 $16,437 $122,529
Total Managed Acquisitions
(3)
. . . . . . . . . . . . . . . . . . . . . . . . . . . . . . . . . . $ 17,198 $ 6,641 $ 23,839 $ 6,367 $ 30,206
(1)
FFELP category is primarily Stafford loans and also includes PLUS and HEAL loans.
(2)
Represents FFELP/Stafford loans that we either own on-balance sheet or in our off-balance sheet securitization trusts that we consolidate.
(3)
The Total Managed Acquisitions line includes incremental consolidations from third parties and acquisitions.
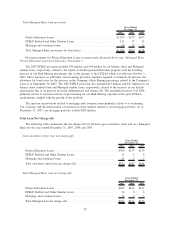
The increase in consolidations to third parties in 2006 reflects FFELP lenders reconsolidating FFELP
Consolidation Loans using the Direct Loan program as a pass-through entity, a practice which was severely
restricted by The Higher Education Reconciliation Act of 2005 as of July 1, 2006. Additionally, the increases
in 2006 and 2007 also reflect the effect of the repeal of the single-holder rule, which was effective for
85