Sallie Mae 2007 Annual Report Download - page 77
Download and view the complete annual report
Please find page 77 of the 2007 Sallie Mae annual report below. You can navigate through the pages in the report by either clicking on the pages listed below, or by using the keyword search tool below to find specific information within the annual report.-
 1
1 -
2
-
3
-
4
-
5
-
6
-
7
-
8
-
9
-
10
-
11
-
12
-
13
-
14
-
15
-
16
-
17
-
18
-
19
-
20
-
21
-
22
-
23
-
24
-
25
-
26
-
27
-
28
-
29
-
30
-
31
-
32
-
33
-
34
-
35
-
36
-
37
-
38
-
39
-
40
-
41
-
42
-
43
-
44
-
45
-
46
-
47
-
48
-
49
-
50
-
51
-
52
-
53
-
54
-
55
-
56
-
57
-
58
-
59
-
60
-
61
-
62
-
63
-
64
-
65
-
66
-
 67
67 -
 68
68 -
 69
69 -
 70
70 -
 71
71 -
 72
72 -
 73
73 -
 74
74 -
 75
75 -
 76
76 -
 77
77 -
 78
78 -
 79
79 -
 80
80 -
 81
81 -
 82
82 -
 83
83 -
 84
84 -
 85
85 -
 86
86 -
 87
87 -
88
-
89
-
90
-
91
-
92
-
93
-
94
-
95
-
96
-
97
-
98
-
99
-
100
-
101
-
102
-
103
-
104
-
105
-
106
-
107
-
108
-
109
-
110
-
111
-
112
-
113
-
114
-
115
-
116
-
117
-
118
-
119
-
120
-
121
-
122
-
123
-
124
-
125
-
126
-
127
-
128
-
129
-
130
-
131
-
132
-
133
-
134
-
135
-
136
-
137
-
138
-
139
-
140
-
141
-
142
-
143
-
144
-
145
-
146
-
147
-
148
-
149
-
150
-
151
-
152
-
153
-
154
-
155
-
156
-
157
-
158
-
159
-
160
-
161
-
162
-
163
-
164
-
165
-
166
-
167
-
168
-
169
-
170
-
171
-
172
-
173
-
174
-
175
-
176
-
177
-
178
-
179
-
180
-
181
-
182
-
183
-
184
-
185
-
186
-
187
-
188
-
189
-
190
-
191
-
192
-
193
-
194
-
195
-
196
-
197
-
198
-
199
-
200
-
201
-
202
-
203
-
204
-
205
-
206
-
207
-
208
-
209
-
210
-
211
-
212
-
213
-
214
-
215
-
216
-
217
-
218
-
219
 |
 |
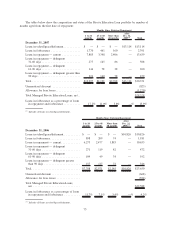
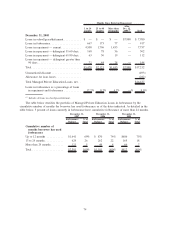
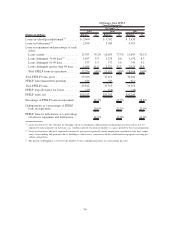
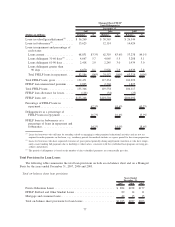
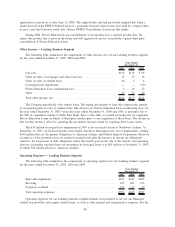
(Dollars in millions) Balance % Balance % Balance %
2007 2006 2005
December 31,
Off-Balance Sheet FFELP
Loan Delinquencies
Loans in-school/grace/deferment
(1)
....... $ 5,060 $ 7,392 $ 7,859
Loans in forbearance
(2)
................ 2,950 3,789 4,781
Loans in repayment and percentage of each
status:
Loans current ..................... 13,703 79.2% 16,655 77.7% 13,694 76.1%
Loans delinquent 31-60 days
(3)
........ 1,017 5.9 1,278 6.0 1,136 6.3
Loans delinquent 61-90 days.......... 577 3.3 777 3.6 749 4.2
Loans delinquent greater than 90 days . . . 1,999 11.6 2,721 12.7 2,425 13.4
Total FFELP loans in repayment ....... 17,296 100% 21,431 100% 18,004 100%
Total FFELP loans, gross .............. 25,306 32,612 30,644
FFELP loan unamortized premium ....... 636 741 611
Total FFELP loans ................... 25,942 33,353 31,255
FFELP loan allowance for losses ........ (29) (14) (10)
FFELP loans, net .................... $25,913 $33,339 $31,245
Percentage of FFELP loans in repayment . . 68.4% 65.7% 58.8%
Delinquencies as a percentage of FFELP
loans in repayment ................. 20.8% 22.3% 23.9%
FFELP loans in forbearance as a percentage
of loans in repayment and forbearance . . 14.6% 15.0% 21.0%
(1)
Loans for borrowers who still may be attending school or engaging in other permitted educational activities and are not yet
required to make payments on the loans, e.g., residency periods for medical students or a grace period for bar exam preparation.
(2)
Loans for borrowers who have requested extension of grace period generally during employment transition or who have tempo-
rarily ceased making full payments due to hardship or other factors, consistent with the established loan program servicing pro-
cedures and policies.
(3)
The period of delinquency is based on the number of days scheduled payments are contractually past due.
76