Sallie Mae 2007 Annual Report Download - page 125
Download and view the complete annual report
Please find page 125 of the 2007 Sallie Mae annual report below. You can navigate through the pages in the report by either clicking on the pages listed below, or by using the keyword search tool below to find specific information within the annual report.-
 1
1 -
2
-
3
-
4
-
5
-
6
-
7
-
8
-
9
-
10
-
11
-
12
-
13
-
14
-
15
-
16
-
17
-
18
-
19
-
20
-
21
-
22
-
23
-
24
-
25
-
26
-
27
-
28
-
29
-
30
-
31
-
32
-
33
-
34
-
35
-
36
-
37
-
38
-
39
-
40
-
41
-
42
-
43
-
44
-
45
-
46
-
47
-
48
-
49
-
50
-
51
-
52
-
53
-
54
-
55
-
56
-
57
-
58
-
59
-
60
-
61
-
62
-
63
-
64
-
65
-
66
-
67
-
68
-
69
-
70
-
71
-
72
-
73
-
74
-
75
-
76
-
77
-
78
-
79
-
80
-
81
-
82
-
83
-
84
-
85
-
86
-
87
-
88
-
89
-
90
-
91
-
92
-
93
-
94
-
95
-
96
-
97
-
98
-
99
-
100
-
101
-
102
-
103
-
104
-
105
-
106
-
107
-
108
-
109
-
110
-
111
-
112
-
113
-
114
-
 115
115 -
 116
116 -
 117
117 -
 118
118 -
 119
119 -
 120
120 -
 121
121 -
 122
122 -
 123
123 -
 124
124 -
 125
125 -
 126
126 -
 127
127 -
 128
128 -
 129
129 -
 130
130 -
 131
131 -
 132
132 -
 133
133 -
 134
134 -
 135
135 -
136
-
137
-
138
-
139
-
140
-
141
-
142
-
143
-
144
-
145
-
146
-
147
-
148
-
149
-
150
-
151
-
152
-
153
-
154
-
155
-
156
-
157
-
158
-
159
-
160
-
161
-
162
-
163
-
164
-
165
-
166
-
167
-
168
-
169
-
170
-
171
-
172
-
173
-
174
-
175
-
176
-
177
-
178
-
179
-
180
-
181
-
182
-
183
-
184
-
185
-
186
-
187
-
188
-
189
-
190
-
191
-
192
-
193
-
194
-
195
-
196
-
197
-
198
-
199
-
200
-
201
-
202
-
203
-
204
-
205
-
206
-
207
-
208
-
209
-
210
-
211
-
212
-
213
-
214
-
215
-
216
-
217
-
218
-
219
 |
 |

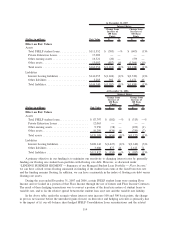
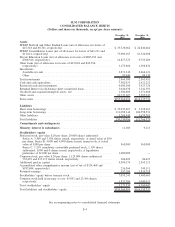
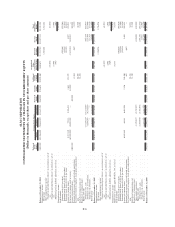
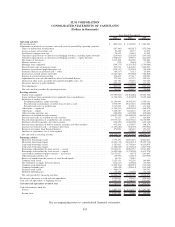
SLM CORPORATION
CONSOLIDATED BALANCE SHEETS
(Dollars and shares in thousands, except per share amounts)
December 31,
2007
December 31,
2006
Assets
FFELP Stafford and Other Student Loans (net of allowance for losses of
$47,518 and $8,701, respectively) ............................... $ 35,726,062 $ 24,840,464
FFELP Consolidation Loans (net of allowance for losses of $41,211 and
$11,614, respectively) ........................................ 73,609,187 61,324,008
Private Education Loans (net of allowance for losses of $885,931 and
$308,346, respectively) ....................................... 14,817,725 9,755,289
Other loans (net of allowance for losses of $47,004 and $20,394,
respectively) ............................................... 1,173,666 1,308,832
Investments
Available-for-sale ........................................... 2,871,340 2,464,121
Other .................................................... 93,040 99,330
Total investments ............................................. 2,964,380 2,563,451
Cash and cash equivalents ....................................... 7,582,031 2,621,222
Restricted cash and investments ................................... 4,600,106 3,423,326
Retained Interest in off-balance sheet securitized loans .................. 3,044,038 3,341,591
Goodwill and acquired intangible assets, net ......................... 1,300,689 1,371,606
Other assets ................................................. 10,747,107 5,585,943
Total assets .................................................. $155,564,991 $116,135,732
Liabilities
Short-term borrowings.......................................... $ 35,947,407 $ 3,528,263
Long-term borrowings .......................................... 111,098,144 104,558,531
Other liabilities ............................................... 3,284,545 3,679,781
Total liabilities ............................................... 150,330,096 111,766,575
Commitments and contingencies
Minority interest in subsidiaries ................................. 11,360 9,115
Stockholders’ equity
Preferred stock, par value $.20 per share, 20,000 shares authorized:
Series A: 3,300 and 3,300 shares issued, respectively, at stated value of $50
per share; Series B: 4,000 and 4,000 shares issued, respectively, at stated
value of $100 per share ....................................... 565,000 565,000
Series C, 7.25% mandatory convertible preferred stock, 1,150 shares
authorized; 1,000 and 0 shares issued, respectively, at liquidation
preference of $1,000 per share .................................. 1,000,000 —
Common stock, par value $.20 per share, 1,125,000 shares authorized:
532,493 and 433,113 shares issued, respectively ..................... 106,499 86,623
Additional paid-in capital ....................................... 4,590,174 2,565,211
Accumulated other comprehensive income (net of tax of $124,468 and
$183,684, respectively) ....................................... 236,364 349,111
Retained earnings ............................................. 557,204 1,834,718
Stockholders’ equity before treasury stock ........................... 7,055,241 5,400,663
Common stock held in treasury at cost: 65,951 and 22,496 shares,
respectively ................................................ 1,831,706 1,040,621
Total stockholders’ equity . . . .................................... 5,223,535 4,360,042
Total liabilities and stockholders’ equity............................. $155,564,991 $116,135,732
See accompanying notes to consolidated financial statements.
F-4