Sallie Mae 2007 Annual Report Download - page 66
Download and view the complete annual report
Please find page 66 of the 2007 Sallie Mae annual report below. You can navigate through the pages in the report by either clicking on the pages listed below, or by using the keyword search tool below to find specific information within the annual report.-
 1
1 -
2
-
3
-
4
-
5
-
6
-
7
-
8
-
9
-
10
-
11
-
12
-
13
-
14
-
15
-
16
-
17
-
18
-
19
-
20
-
21
-
22
-
23
-
24
-
25
-
26
-
27
-
28
-
29
-
30
-
31
-
32
-
33
-
34
-
35
-
36
-
37
-
38
-
39
-
40
-
41
-
42
-
43
-
44
-
45
-
46
-
47
-
48
-
49
-
50
-
51
-
52
-
53
-
54
-
55
-
 56
56 -
 57
57 -
 58
58 -
 59
59 -
 60
60 -
 61
61 -
 62
62 -
 63
63 -
 64
64 -
 65
65 -
 66
66 -
 67
67 -
 68
68 -
 69
69 -
 70
70 -
 71
71 -
 72
72 -
 73
73 -
 74
74 -
 75
75 -
 76
76 -
77
-
78
-
79
-
80
-
81
-
82
-
83
-
84
-
85
-
86
-
87
-
88
-
89
-
90
-
91
-
92
-
93
-
94
-
95
-
96
-
97
-
98
-
99
-
100
-
101
-
102
-
103
-
104
-
105
-
106
-
107
-
108
-
109
-
110
-
111
-
112
-
113
-
114
-
115
-
116
-
117
-
118
-
119
-
120
-
121
-
122
-
123
-
124
-
125
-
126
-
127
-
128
-
129
-
130
-
131
-
132
-
133
-
134
-
135
-
136
-
137
-
138
-
139
-
140
-
141
-
142
-
143
-
144
-
145
-
146
-
147
-
148
-
149
-
150
-
151
-
152
-
153
-
154
-
155
-
156
-
157
-
158
-
159
-
160
-
161
-
162
-
163
-
164
-
165
-
166
-
167
-
168
-
169
-
170
-
171
-
172
-
173
-
174
-
175
-
176
-
177
-
178
-
179
-
180
-
181
-
182
-
183
-
184
-
185
-
186
-
187
-
188
-
189
-
190
-
191
-
192
-
193
-
194
-
195
-
196
-
197
-
198
-
199
-
200
-
201
-
202
-
203
-
204
-
205
-
206
-
207
-
208
-
209
-
210
-
211
-
212
-
213
-
214
-
215
-
216
-
217
-
218
-
219
 |
 |

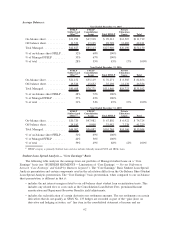
excluding the impact of the interest reserving method discussed above. The primary drivers of changes in the
spread are changes in portfolio composition, borrower benefits, premium amortization, and cost of funds. The
FFELP loan spread declined over all periods presented above primarily due to increased cost of funds, Front-
End Borrower Benefits (Stafford), and a decline in hedged Floor Income (Consolidation). The Private
Education Loan spreads before provision, excluding the impact of the interest reserving method discussed
above, continued to increase due primarily to a change in the mix of the portfolio to more direct-to-consumer
loans (Tuition Answer loans). The changes in the Private Education Loan spreads after provision for all
periods was primarily due to the timing and amount of provision associated with our allowance for Private
Education Loan Losses as discussed below in “Private Education Loans.”
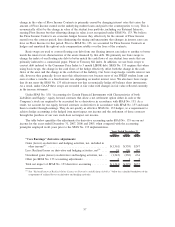
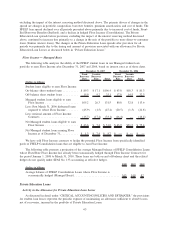
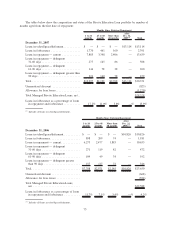
Floor Income — Managed Basis
The following table analyzes the ability of the FFELP student loans in our Managed student loan
portfolio to earn Floor Income after December 31, 2007 and 2006, based on interest rates as of those dates.
Fixed
Borrower
Rate
Variable
Borrower
Rate Total
Fixed
Borrower
Rate
Variable
Borrower
Rate Total
December 31, 2007 December 31, 2006
(Dollars in billions)
Student loans eligible to earn Floor Income:
On-balance sheet student loans .......... $ 89.3 $ 17.1 $106.4 $ 63.0 $18.3 $ 81.3
Off-balance sheet student loans .......... 15.9 9.2 25.1 17.8 14.5 32.3
Managed student loans eligible to earn
Floor Income ..................... 105.2 26.3 131.5 80.8 32.8 113.6
Less: Post March 31, 2006 disbursed loans
required to rebate Floor Income ........ (45.9) (1.5) (47.4) (20.5) (1.3) (21.8)
Less: notional amount of Floor Income
Contracts ........................ (15.7) (17.4) (33.1) (16.4) — (16.4)
Net Managed student loans eligible to earn
Floor Income ..................... $ 43.6 $ 7.4 $ 51.0 $ 43.9 $31.5 $ 75.4
Net Managed student loans earning Floor
Income as of December 31, ........... $ 1.3 $ 7.4 $ 8.7 $ — $ — $ —
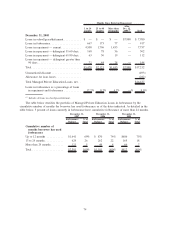
We have sold Floor Income contracts to hedge the potential Floor Income from specifically identified
pools of FFELP Consolidation loans that are eligible to earn Floor Income.
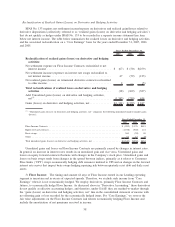
The following table presents a projection of the average Managed balance of FFELP Consolidation Loans
whose Fixed Rate Floor Income has already been economically hedged through Floor Income Contracts for
the period January 1, 2008 to March 31, 2010. These loans are both on and off-balance sheet and the related
hedges do not qualify under SFAS No. 133 accounting as effective hedges.
2008 2009 2010
(Dollars in billions)
Average balance of FFELP Consolidation Loans whose Floor Income is
economically hedged (Managed Basis) ............................. $15 $10 $2
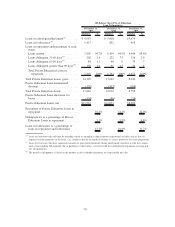
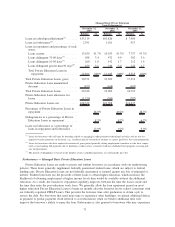
Private Education Loans
Activity in the Allowance for Private Education Loan Losses
As discussed in detail under “CRITICAL ACCOUNTING POLICIES AND ESTIMATES,” the provisions
for student loan losses represent the periodic expense of maintaining an allowance sufficient to absorb losses,
net of recoveries, incurred in the portfolio of Private Education Loans.
65