Sallie Mae 2007 Annual Report Download - page 44
Download and view the complete annual report
Please find page 44 of the 2007 Sallie Mae annual report below. You can navigate through the pages in the report by either clicking on the pages listed below, or by using the keyword search tool below to find specific information within the annual report.-
 1
1 -
2
-
3
-
4
-
5
-
6
-
7
-
8
-
9
-
10
-
11
-
12
-
13
-
14
-
15
-
16
-
17
-
18
-
19
-
20
-
21
-
22
-
23
-
24
-
25
-
26
-
27
-
28
-
29
-
30
-
31
-
32
-
33
-
 34
34 -
 35
35 -
 36
36 -
 37
37 -
 38
38 -
 39
39 -
 40
40 -
 41
41 -
 42
42 -
 43
43 -
 44
44 -
 45
45 -
 46
46 -
 47
47 -
 48
48 -
 49
49 -
 50
50 -
 51
51 -
 52
52 -
 53
53 -
 54
54 -
55
-
56
-
57
-
58
-
59
-
60
-
61
-
62
-
63
-
64
-
65
-
66
-
67
-
68
-
69
-
70
-
71
-
72
-
73
-
74
-
75
-
76
-
77
-
78
-
79
-
80
-
81
-
82
-
83
-
84
-
85
-
86
-
87
-
88
-
89
-
90
-
91
-
92
-
93
-
94
-
95
-
96
-
97
-
98
-
99
-
100
-
101
-
102
-
103
-
104
-
105
-
106
-
107
-
108
-
109
-
110
-
111
-
112
-
113
-
114
-
115
-
116
-
117
-
118
-
119
-
120
-
121
-
122
-
123
-
124
-
125
-
126
-
127
-
128
-
129
-
130
-
131
-
132
-
133
-
134
-
135
-
136
-
137
-
138
-
139
-
140
-
141
-
142
-
143
-
144
-
145
-
146
-
147
-
148
-
149
-
150
-
151
-
152
-
153
-
154
-
155
-
156
-
157
-
158
-
159
-
160
-
161
-
162
-
163
-
164
-
165
-
166
-
167
-
168
-
169
-
170
-
171
-
172
-
173
-
174
-
175
-
176
-
177
-
178
-
179
-
180
-
181
-
182
-
183
-
184
-
185
-
186
-
187
-
188
-
189
-
190
-
191
-
192
-
193
-
194
-
195
-
196
-
197
-
198
-
199
-
200
-
201
-
202
-
203
-
204
-
205
-
206
-
207
-
208
-
209
-
210
-
211
-
212
-
213
-
214
-
215
-
216
-
217
-
218
-
219
 |
 |

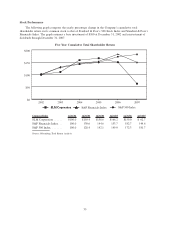
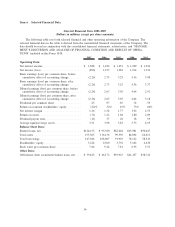
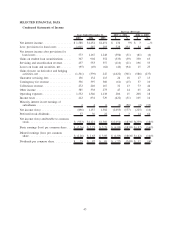
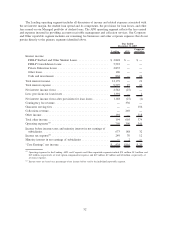
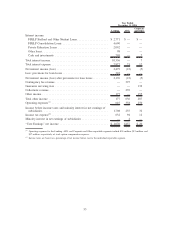
SELECTED FINANCIAL DATA
Condensed Statements of Income
2007 2006 2005 $ % $ %
Years Ended December 31, 2007 vs. 2006 2006 vs. 2005
Increase (Decrease)
Net interest income .................. $1,588 $1,454 $1,451 $ 134 9% $ 3 —%
Less: provisions for loan losses ......... 1,015 287 203 728 254 84 41
Net interest income after provisions for
loan losses ....................... 573 1,167 1,248 (594) (51) (81) (6)
Gains on student loan securitizations ..... 367 902 552 (535) (59) 350 63
Servicing and securitization revenue ...... 437 553 357 (116) (21) 196 55
Losses on loans and securities, net ....... (95) (49) (64) (46) (94) 15 23
Gains (losses) on derivative and hedging
activities, net ..................... (1,361) (339) 247 (1,022) (301) (586) (237)
Guarantor servicing fees .............. 156 132 115 24 18 17 15
Contingency fee revenue .............. 336 397 360 (61) (15) 37 10
Collections revenue .................. 272 240 167 32 13 73 44
Other income ...................... 385 338 273 47 14 65 24
Operating expenses .................. 1,552 1,346 1,138 206 15 208 18
Income taxes ....................... 412 834 729 (422) (51) 105 14
Minority interest in net earnings of
subsidiaries ...................... 2 4 6 (2) (50) (2) (33)
Net income (loss) ................... (896) 1,157 1,382 (2,053) (177) (225) (16)
Preferred stock dividends .............. 37 36 22 1 3 14 64
Net income (loss) attributable to common
stock ........................... $ (933) $1,121 $1,360 $(2,054) (183)% $(239) (18)%
Basic earnings (loss) per common share . . . $ (2.26) $ 2.73 $ 3.25 $ (4.99) (183)% $ (.52) (16)%
Diluted earnings (loss) per common
share ........................... $ (2.26) $ 2.63 $ 3.05 $ (4.89) (186)% $ (.42) (14)%
Dividends per common share ........... $ .25 $ .97 $ .85 $ (.72) (74)% $ .12 14%
43